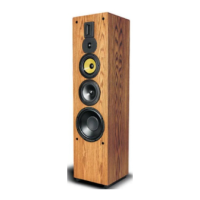
To the right is the irregular frequency response of a
speaker on axis in the presence of room boundaries.
The smoothed curve is the result of applying
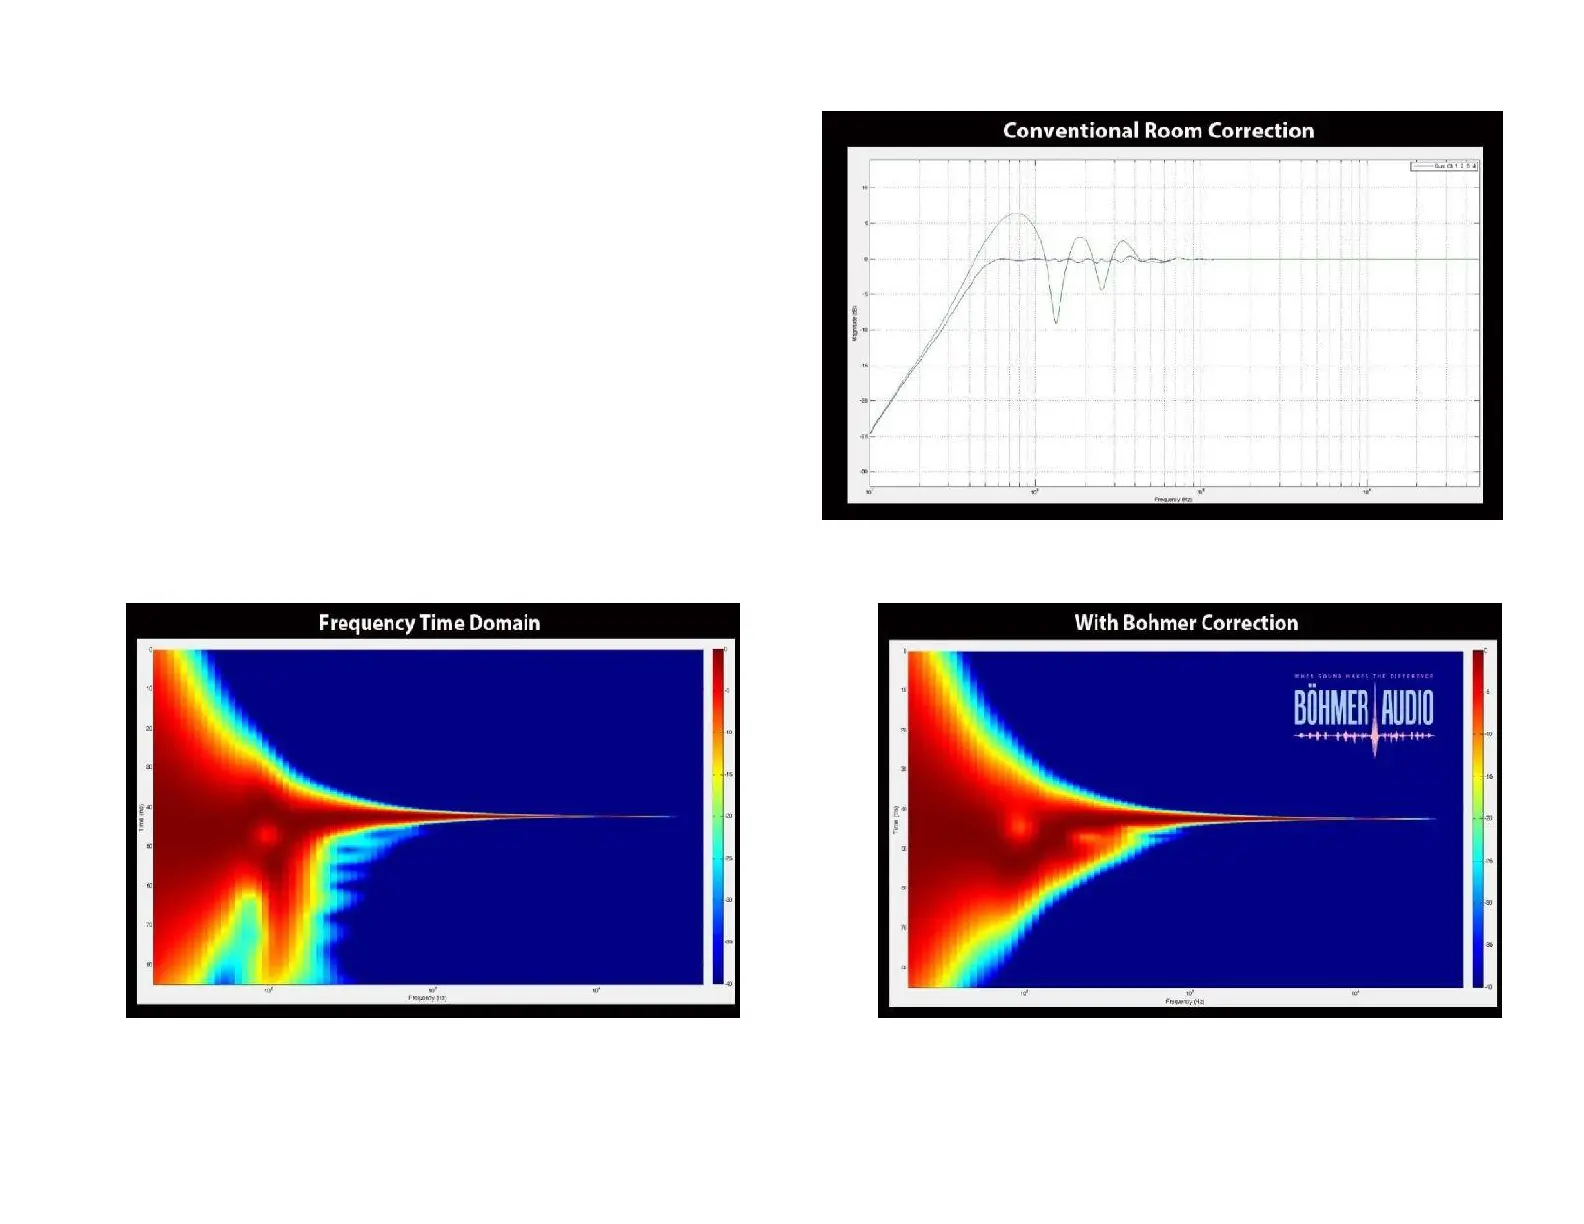
conventional room correction methods. Below left is
the impact of the correction on the Fequency-Time
domain. Below right is the same wavelet plot with the
Bohmer correction method.
 Loading...