EasyManua.ls Logo

Lindab DRU - DIRU;DIRBU;DIRVU Pressure Drop Graphs; DIRU;DIRBU;DIRVU Flow Graphs for Balancing

Lindab DRU
34 pages
Print Icon
To Next Page IconTo Next Page
To Previous Page IconTo Previous Page
Loading...
20
We reserve the right to make changes without prior notice
lindab | we simplify construction
15 20 30 40 50 100
q
10
20
30
40
50
100
200
300
∆p
m
k
[m/s]
[l/s]
[Pa]
2345 10
v
1,5
2,0
2,5
3,0
3,5
4,0
4,5
5,0
5,5
6,0
Ø100
20
30
50
100
200
300
500
[Pa]
∆p
t
Ø100
10
820304050 120100
[l/s]
[m/s]
q
v
k
123451015
1,5 2,0
2,5 3,0 3,5 4,0
4,5
5,0
5,5
6,0
40
45
50
55
60
65
70
75
85
80
L
WA
[dB]
25 30 40 50 100 150
q
10
20
30
40
50
100
200
300
∆p
m
k
[m/s]
[l/s]
[Pa]
34510
v
1,5
2,0
3,0
4,0
5,0
6,0
7,0
8,0
9,0
10
Ø125
20
30
50
100
200
300
500
[Pa]
∆p
t
Ø125
15
12 20 30 40 50 180100
[l/s]
[m/s]
q
v
k
123451015
1,5 2,0
3,0 4,0 5,0
6,0
7,0
8,0
9,0
10,0
40
35
45
50
55
60
65
70
L
WA
[dB]
q
1510 20 30 40 50 60
10
20
30
40
50
100
200
300
v
11109876
5432
[Pa]
[l/s]
[m/s]
∆p
m
k
Ø80
1,5
1,0
2,0
2,5
3,0
3,5
4,0
20
30
50
100
200
300
500
[Pa]
∆p
t
Ø80
10
52030405075
[l/s]
[m/s]
q
v
k
123451015
1,51,0 2,0
2,5
3,0
3,5
4,0
40
35
45
50
55
60
65
70
75
80
85
90
L
WA
[dB]
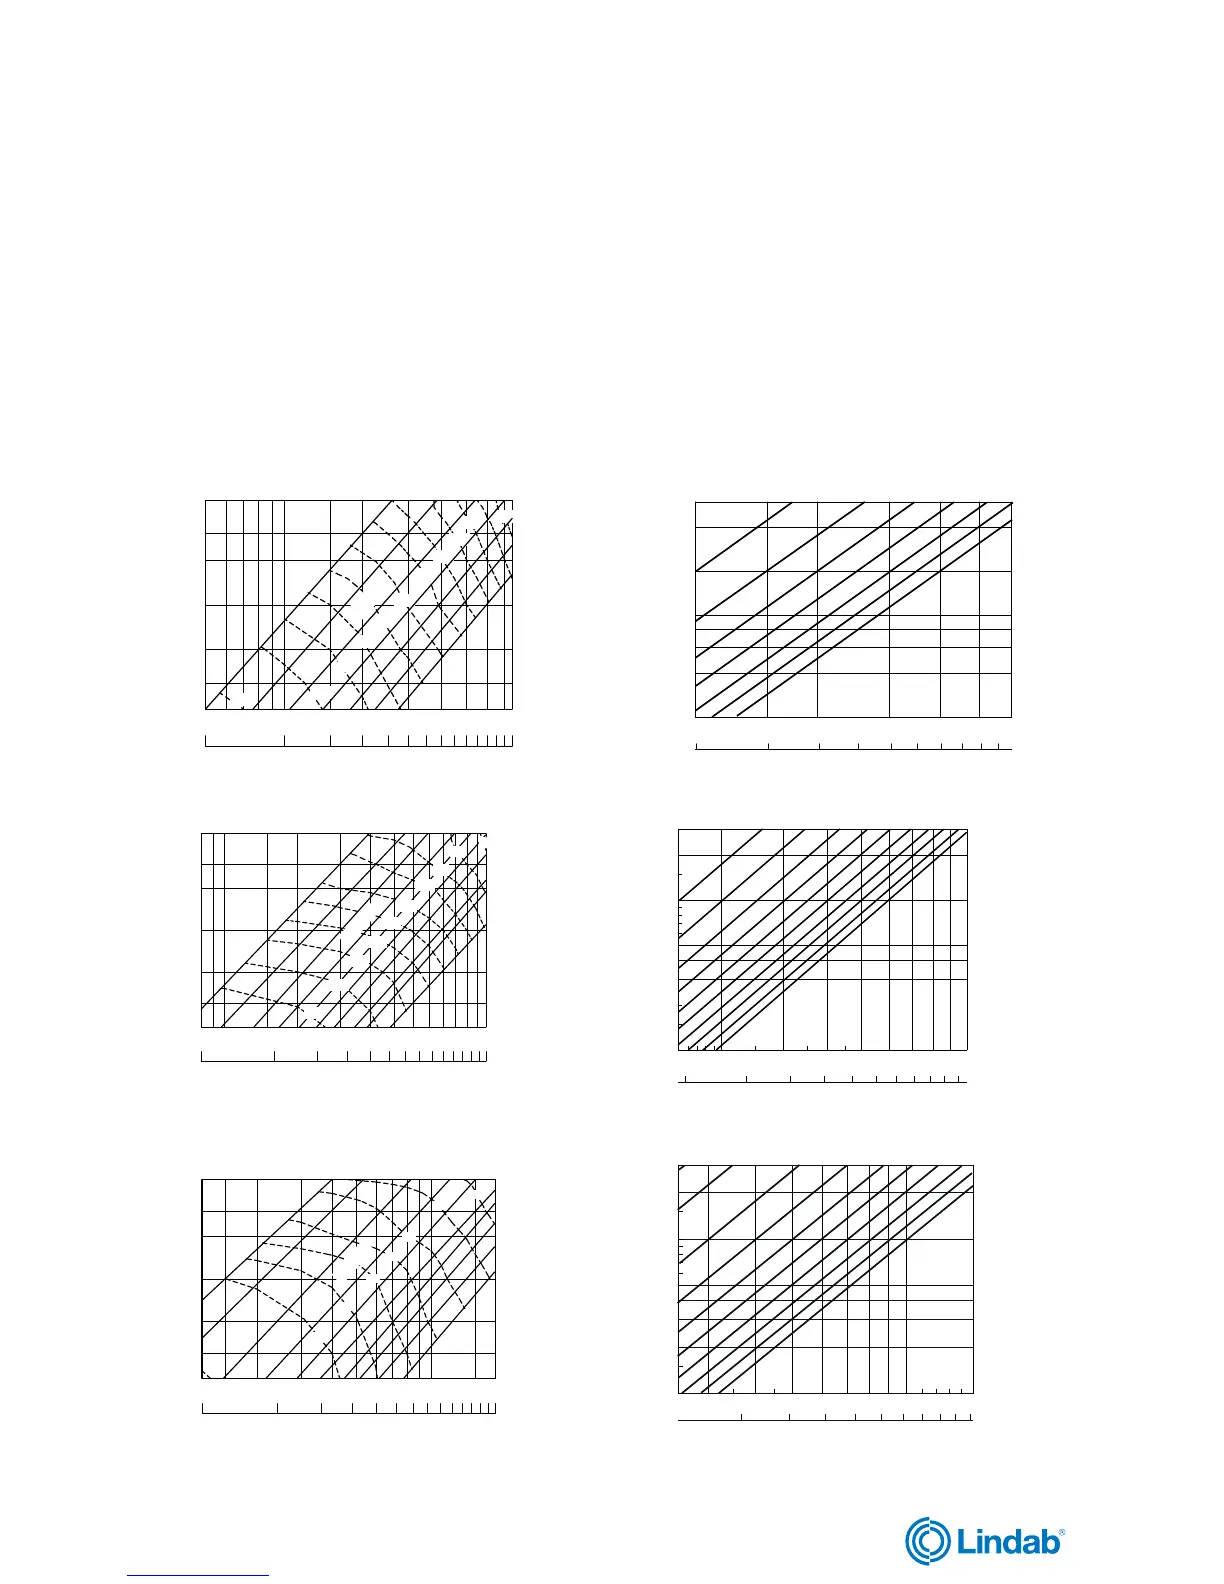
Flow graphs for balancing
The balancing graphs show the flow as a function of the
measured pressure, p
m
. These graphs should be used
to balance the system.
Pressure drop graphs with noise genera-
tion for dimensioning
The dimensioning graphs show the pressure drop over
the damper with flow meter, p
t
. They should be used to
determine the pressure drop and to provide information
about sound power levels at different settings.
Damper with flow meter
DIRU, DIRBU, DIRVU

Other manuals for Lindab DRU

Related product manuals