In addition to Line and Speedometer Graphs, MegaVision also supports bar graphs. You can
display data from any counter with bars. You can add data from a counter to an existing bar
graph (default), or generate a new graph Use bar graphs for comparing the relative amounts
of two or more values. The basic rules for configuring bar graphs are the same as for line
graphs.
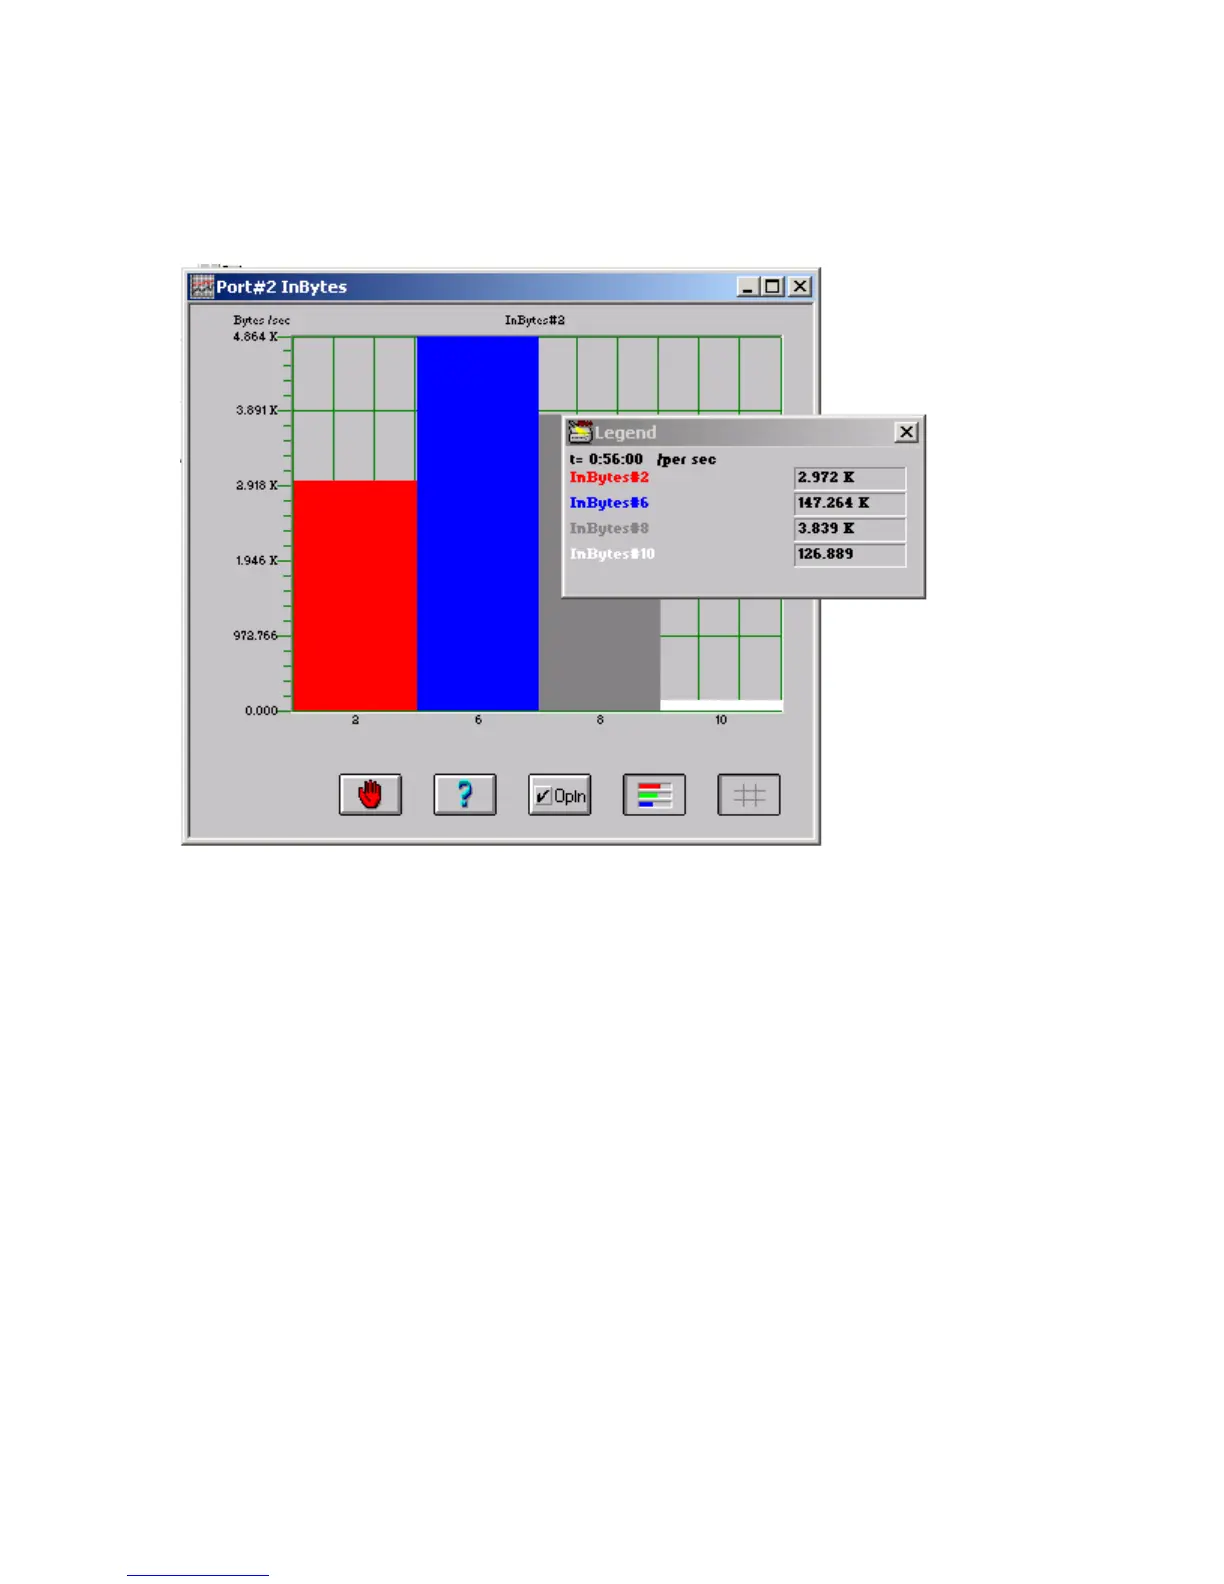
Figure 14. Bar Graph.
The buttons at the bottom of the window have the same function as those in the line graphs
window.
 Loading...