Graphics Support
You can graphically view counters data as speedometer, line, or bar graphs. These alternate
views of data make it easier to analyze and compare statistics at a glance. A tiling option
allows you to neatly line up several graphic windows on the screen. Statistics in any window
that contains the Graphics image can be viewed as a graph. The Ports button will open a
graph window, which allows seeing graphs for all the counters per selected port. The Cnts
button will open a graph window, which allows seeing graphs for all the ports per selected
counter.
Figure 7. Graphics Image.
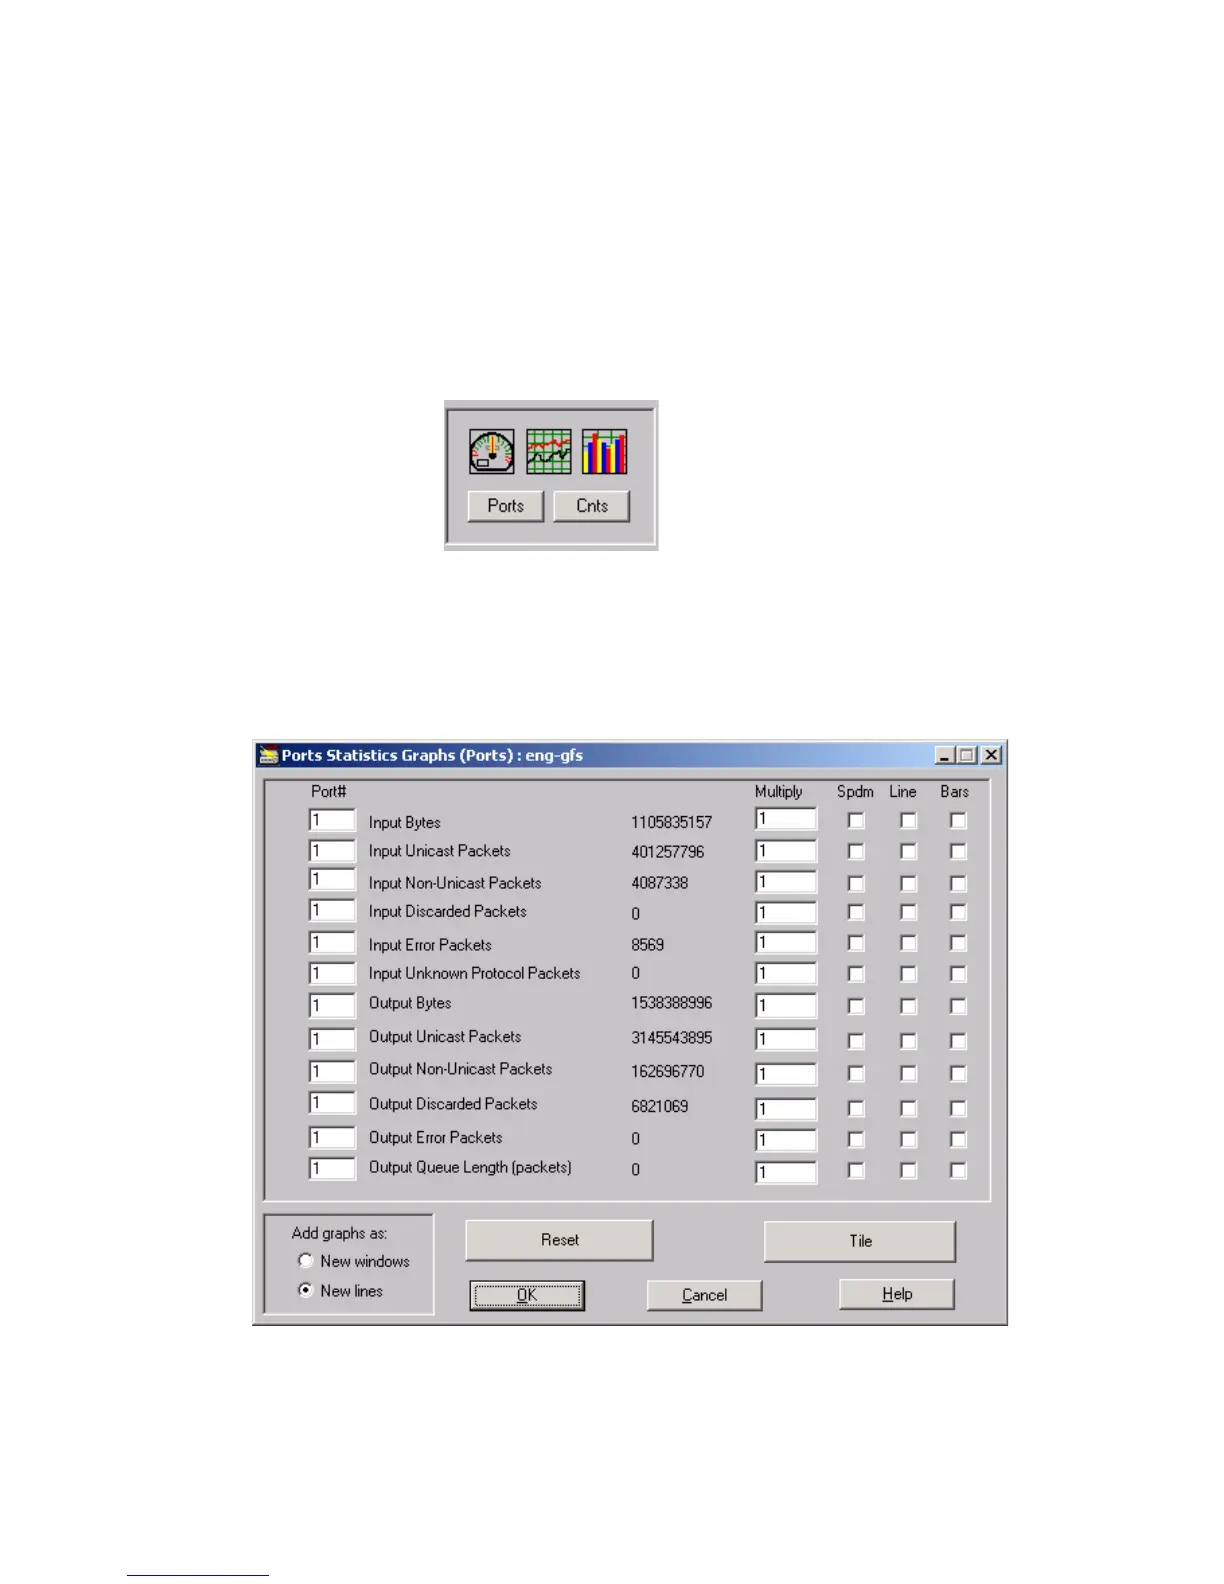
Figure 8 is an example of a window with graph support. Whenever you encounter a window
with graphic support elements, counter data can be viewed as a speedometer, line or bars
graph.
Figure 8. Graphic Support Elements in a typical graph Window