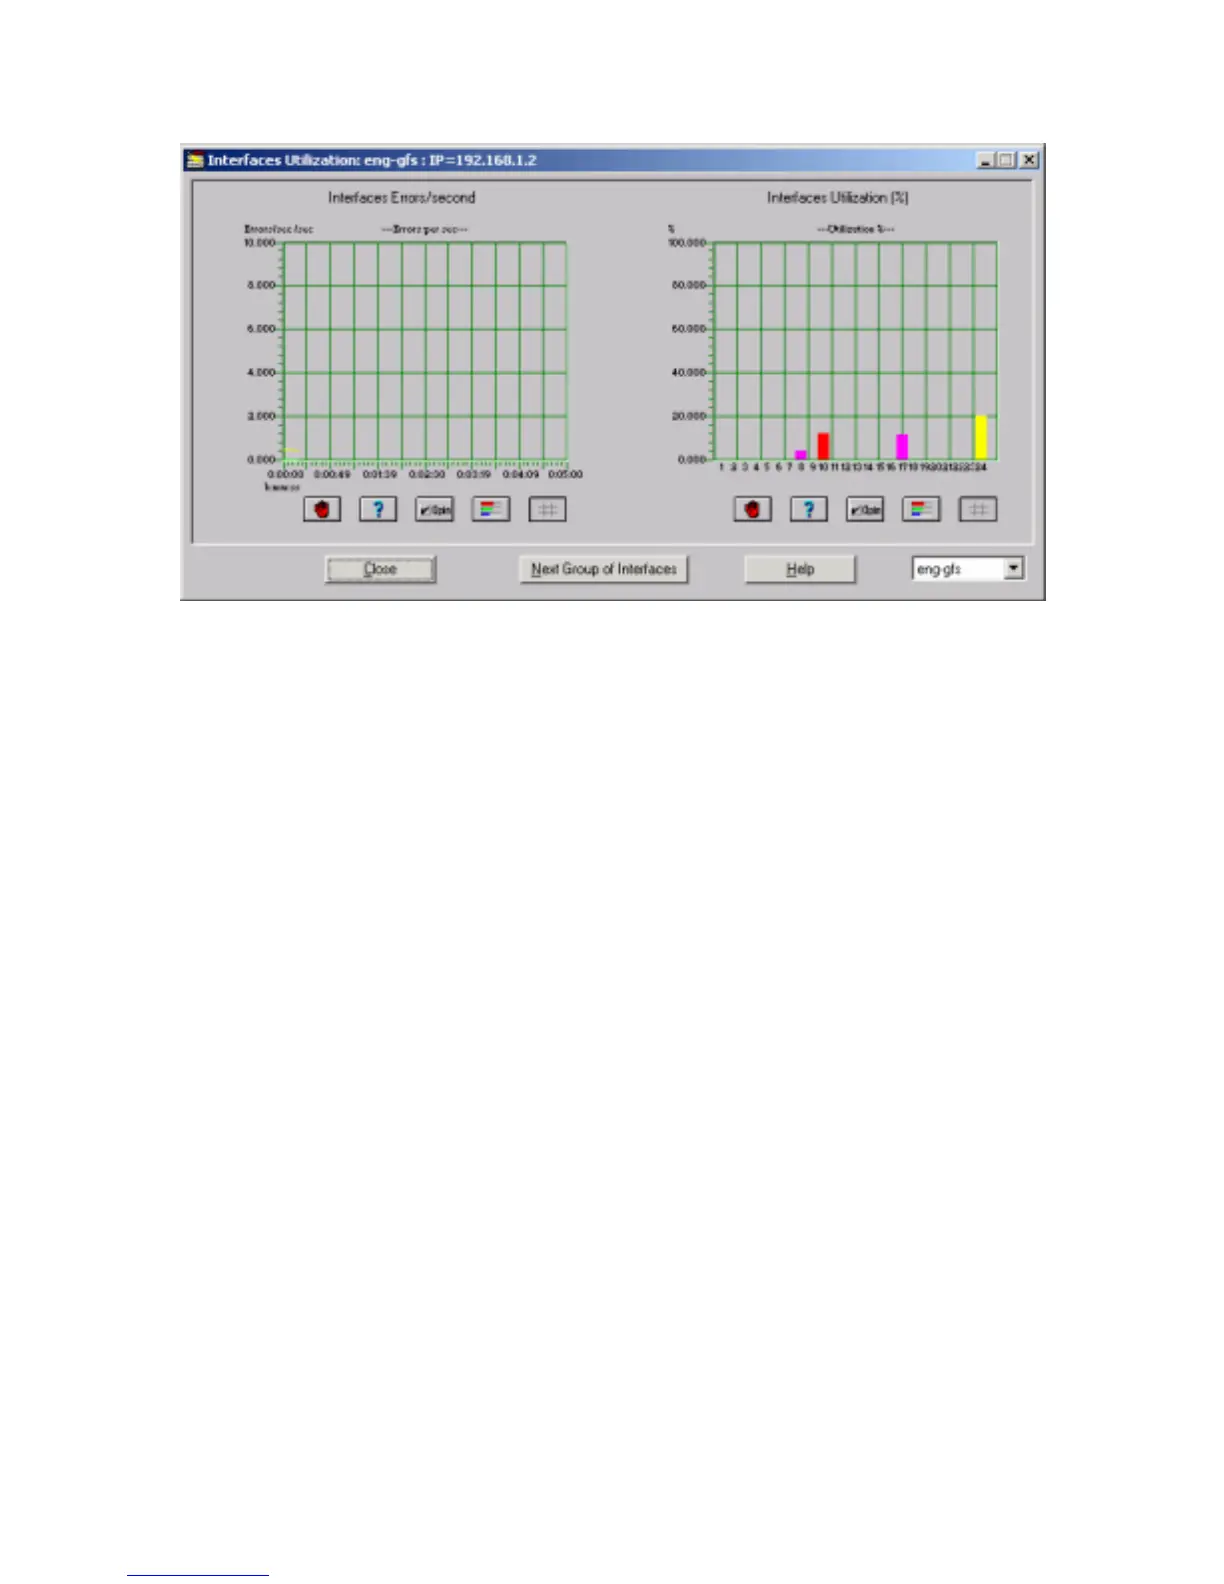
Figure 24. Interfaces Utilization window
The buttons at the bottom of the graphs have the same function as those in the line graphs
window. This window shows the interface’s utilization in percent (right bar graphs) and the
interface’s errors per second (left trend graph). The information is based on device Interface
Table (ifTable from MIB-II, RFC1213). You can use the standard Graphics Support for this
window (described in the “Graphics Support” section).



 To Next Page