IMPACT ECHO (IE)
www.olsoninstruments.com www.olsonengineering.com
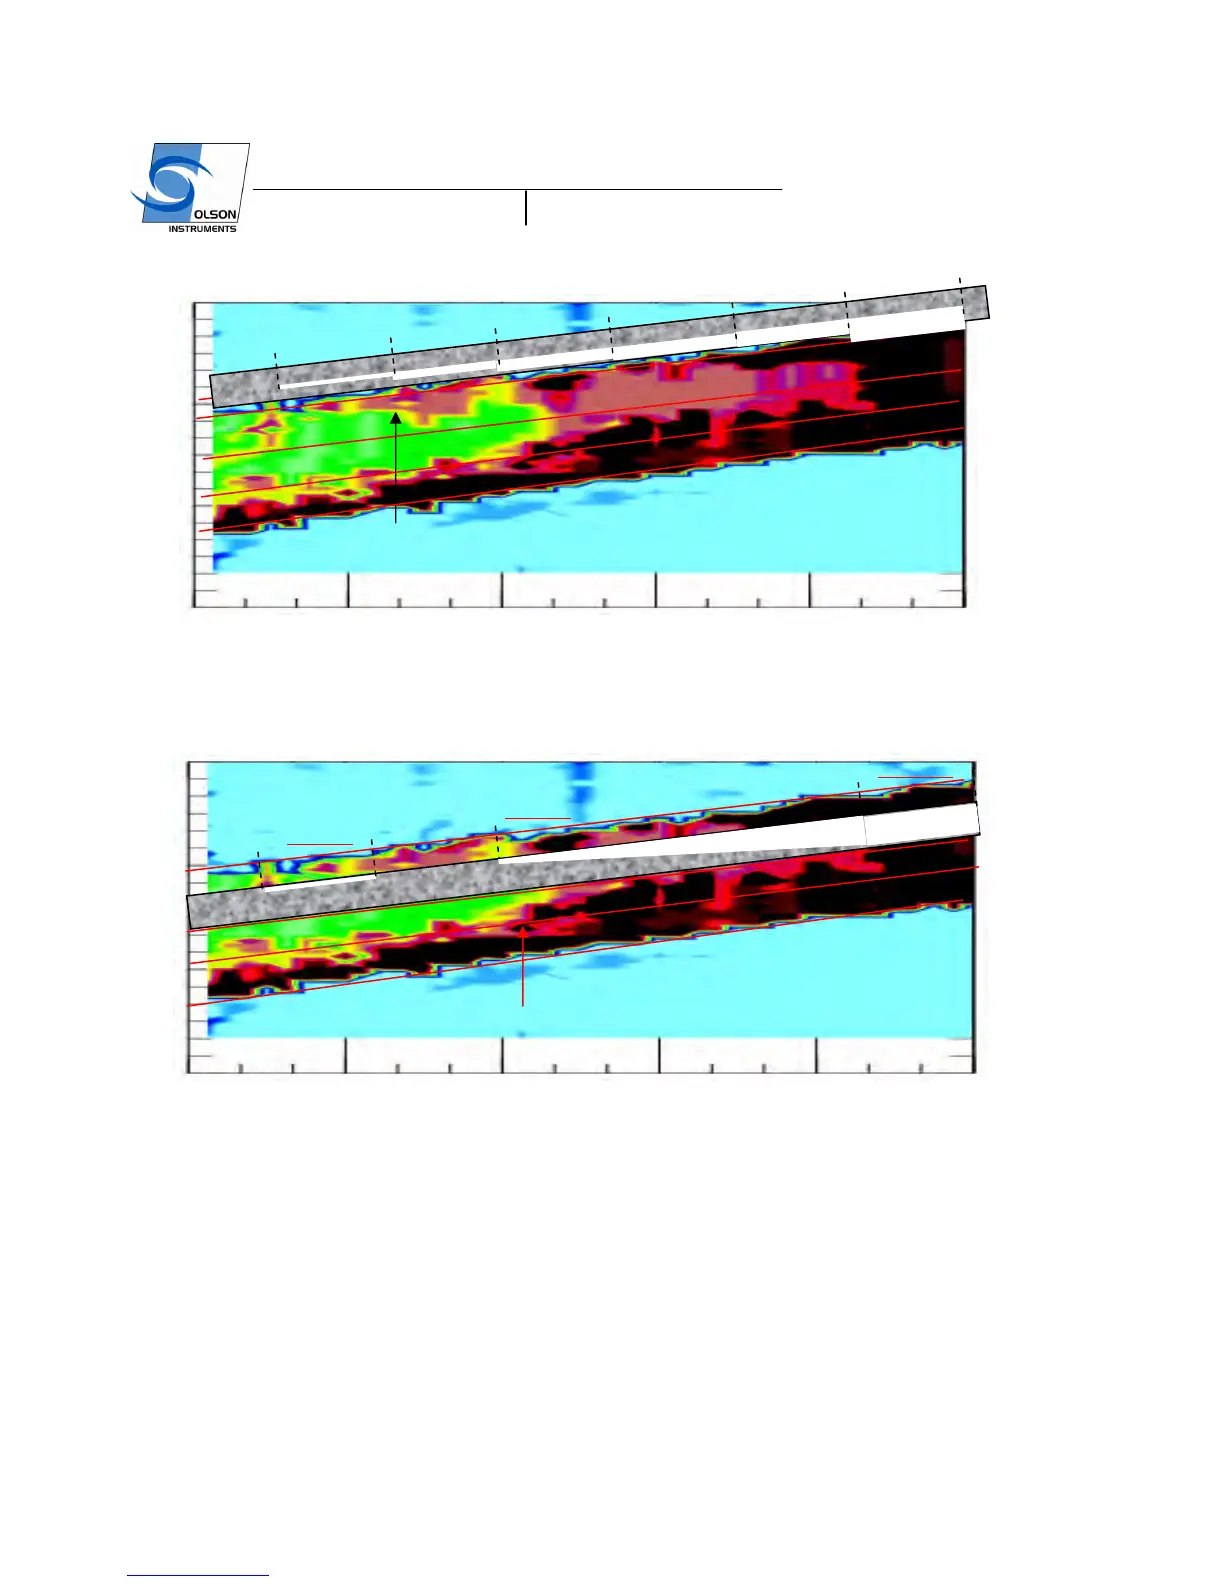
Length of Wall (inches)
48 96 144 240 16 32 64 80 112 128 160 224 0
West End East End
176 192 208
0
4.8
4
3.2
2.4
1.6
0.8
Wall Height (ft)
Grout defect appears at a length of 64 inches
Figure 9 – IE Results from the North Wall with the Actual Design Defects of the Second Duct
Figure 10 – IE Results from the North Wall with the Actual Design Defects of the Third Duct
EXPERIMENTAL IE SCANNER RESULTS FROM THE MOCKUP SLAB
An IE scanner was used on the mockup slab to perform the Impact-Echo Scanning. The tests were
performed every 50 mm in a line fashion parallel to the direction of the ducts across the 13 ft (4 m) wide
slab. A total of 200 scan lines was performed on this specimen. This paper includes data interpretation
from only one duct from the slab. A zoomed-in 3D surface plot of the IES thickness result from a duct
and its actual defect design are presented in Figure 11. The diameter of Duct A is 120 mm or 4.72 inches
with concrete cover of 70 mm or 2.76 inches. Figure 11 shows a 3D surface plot of the IE thickness from
Duct A in the top picture. The middle picture in Figure 11 shows an interpretation of the IE results in the
top picture and the bottom picture in Figure 11 is the actual defect design. Reviews of Figure 11 show
Length of Wall (inches)
48 96 144 240 16 32 64 80 112 128 160 224 0
West End East End
176 192 208
0
4.8
4
3.2
2.4
1.6
0.8
Wall Height (ft)
Grout defect appears at 102”
 Loading...