IMPACT ECHO (IE)
www.olsoninstruments.com www.olsonengineering.com
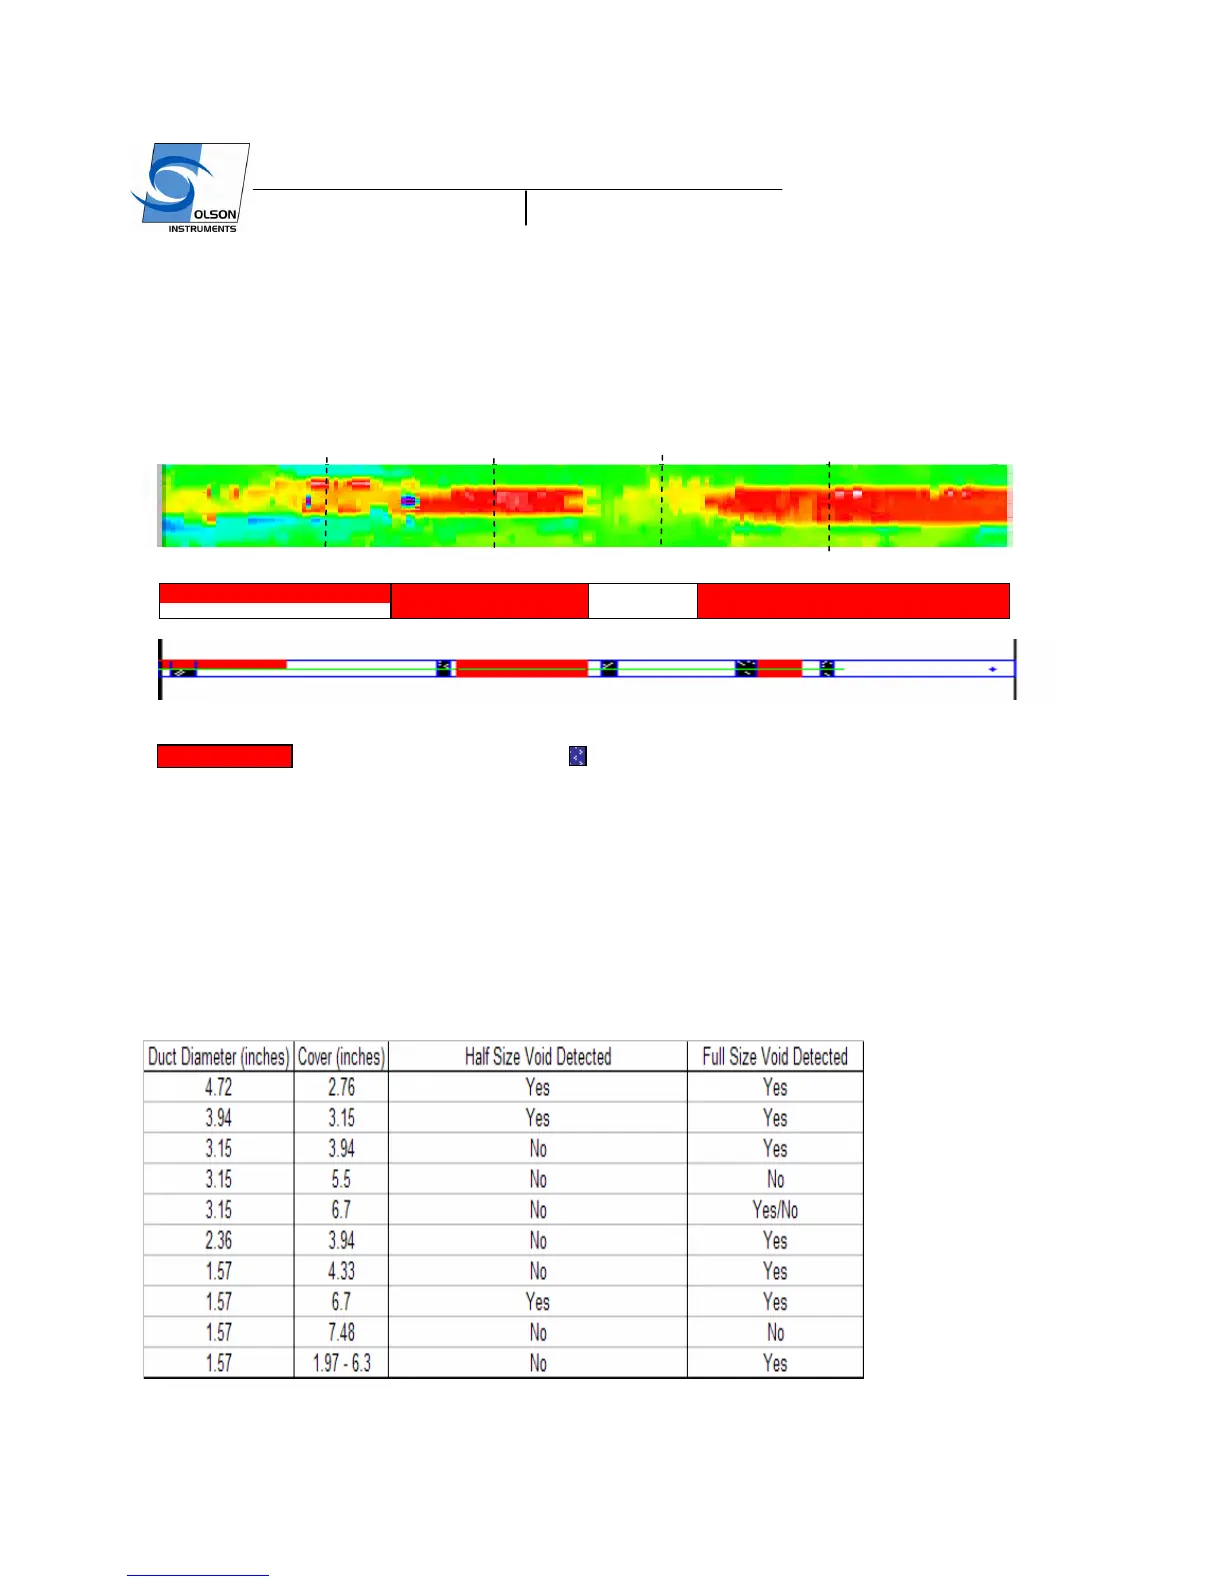
half diameter grout void (Defect A) was detected and complete grout voids (Defects B and C) were also
detected. However, the IE test result shows more defects than the actual defect design. The IE result
shows grout defects toward the right end of the duct where grout defects were not intended to be at the
location. This may be due to local debonding between the grout and metal duct at that location. In
addition, the IE results cannot identify the difference between the silicone contamination (simulates
debonding) and actual grout defects.
Figure 11 – Comparison of IES Test Results (and its interpretation) and the Actual Defect Design – Duct A
Results from the Sensitivity Studies in the Mockup Slab
Table II summarizes the grout defect size that can be detected in ducts of different diameters and concrete
covers.
Table II – Impact-Echo Scanning Duct Void Sensitivity Study Results from the BAM Mockup Slab
(Maximum Frequency Generated by the Excitation = 25 kHz)
SUMMARY
0 0.8 1.6 2.4 3.2 4
Duct Length (meter)
Grout Void Silicone contamination
3D IE Thickness Result
Interpretation from the IES test result
Defect Design
A B C
 Loading...