Photoelectric Effect Apparatus Model No. AP-8209
19
®
Analysis
1. Plot the graphs of Current (y-axis) versus Voltage (x-axis) for the three spectral lines, 436
nm, 546 nm, and 577 nm, at the one intensity.
Questions
1. How do the curves of current versus voltage for the three spectral lines at a constant intensity
compare? In other words, how are the curves similar to each other?
2. How do the curves of current versus voltage for the three spectral lines at a constant
intensity contrast? In other words, how do the curves differ from each other.
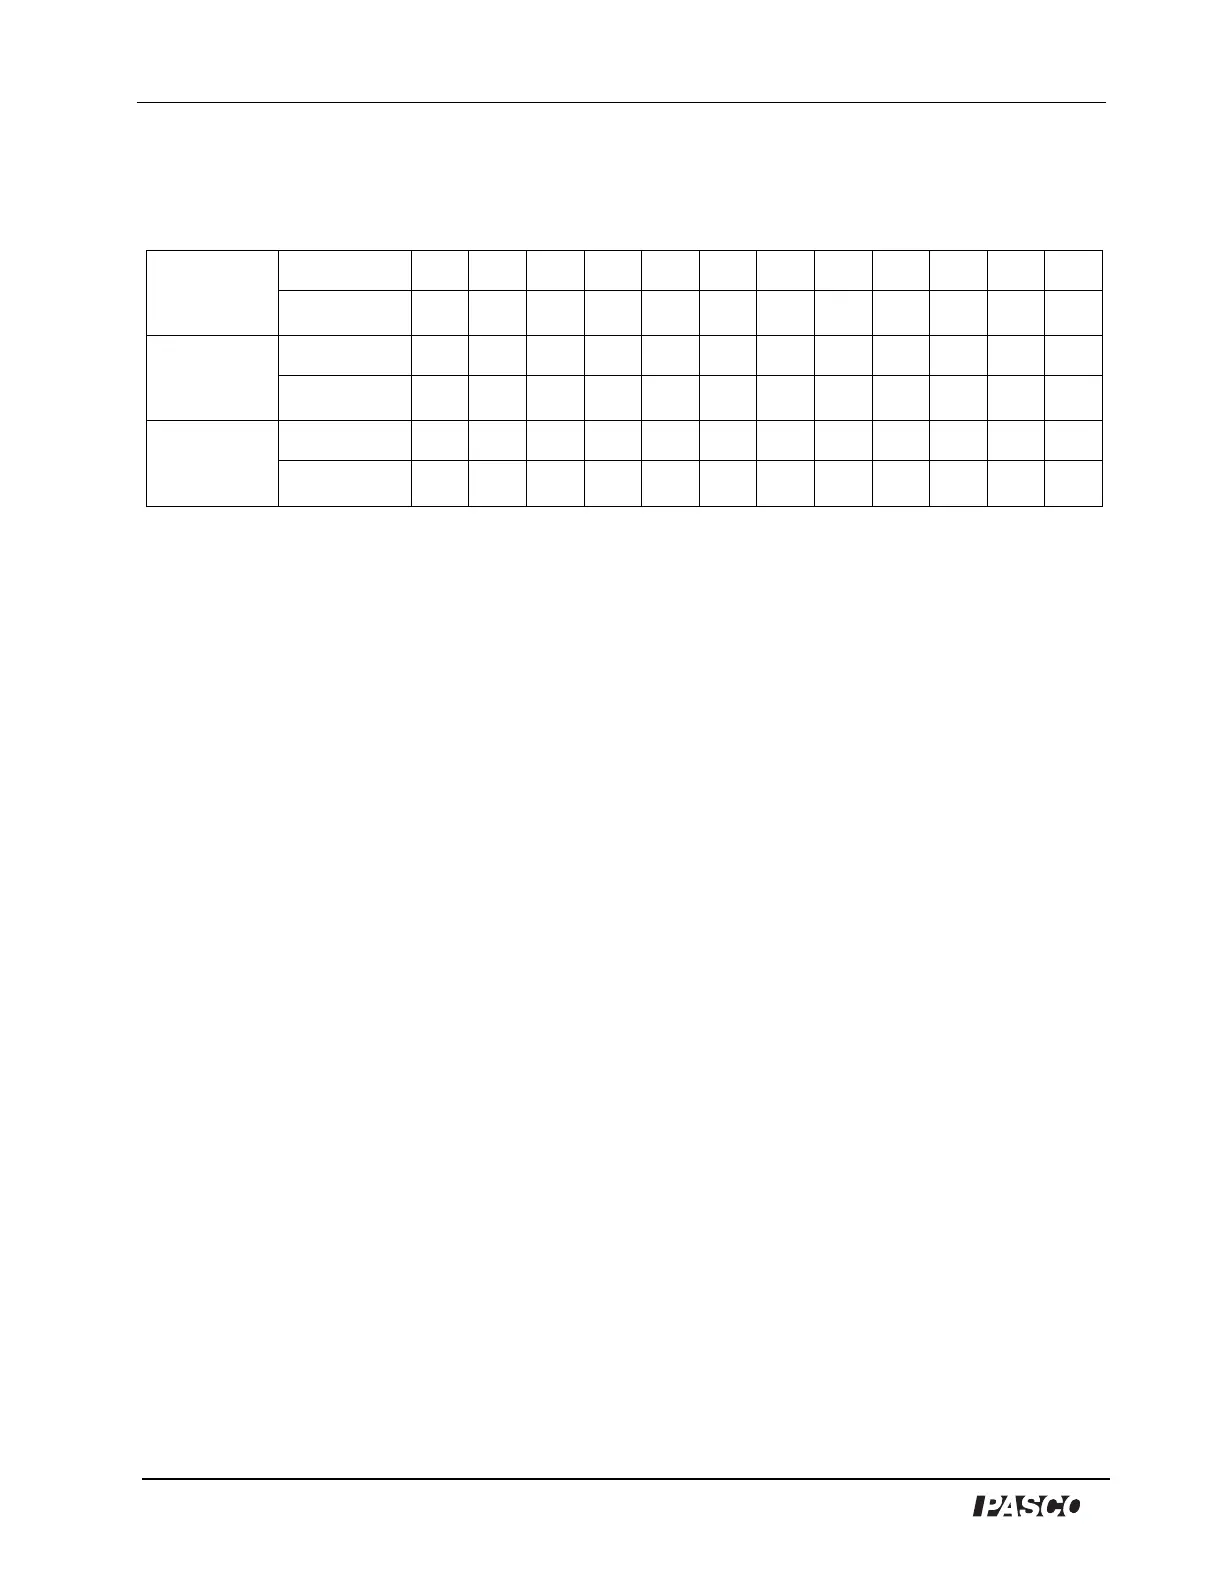
Table 5: Current and Voltage of Spectral Lines
λ = 435.8 nm
4 mm dia.
V (V)
I (x 10
-11
A)
λ = 546.1 nm
4 mm dia.
V (V)
I (x 10
-11
A)
λ = 577.0 nm
4 mm dia.
V (V)
I (x 10
-11
A)