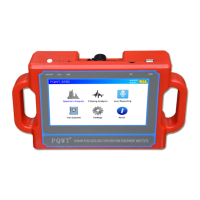
Figure 18
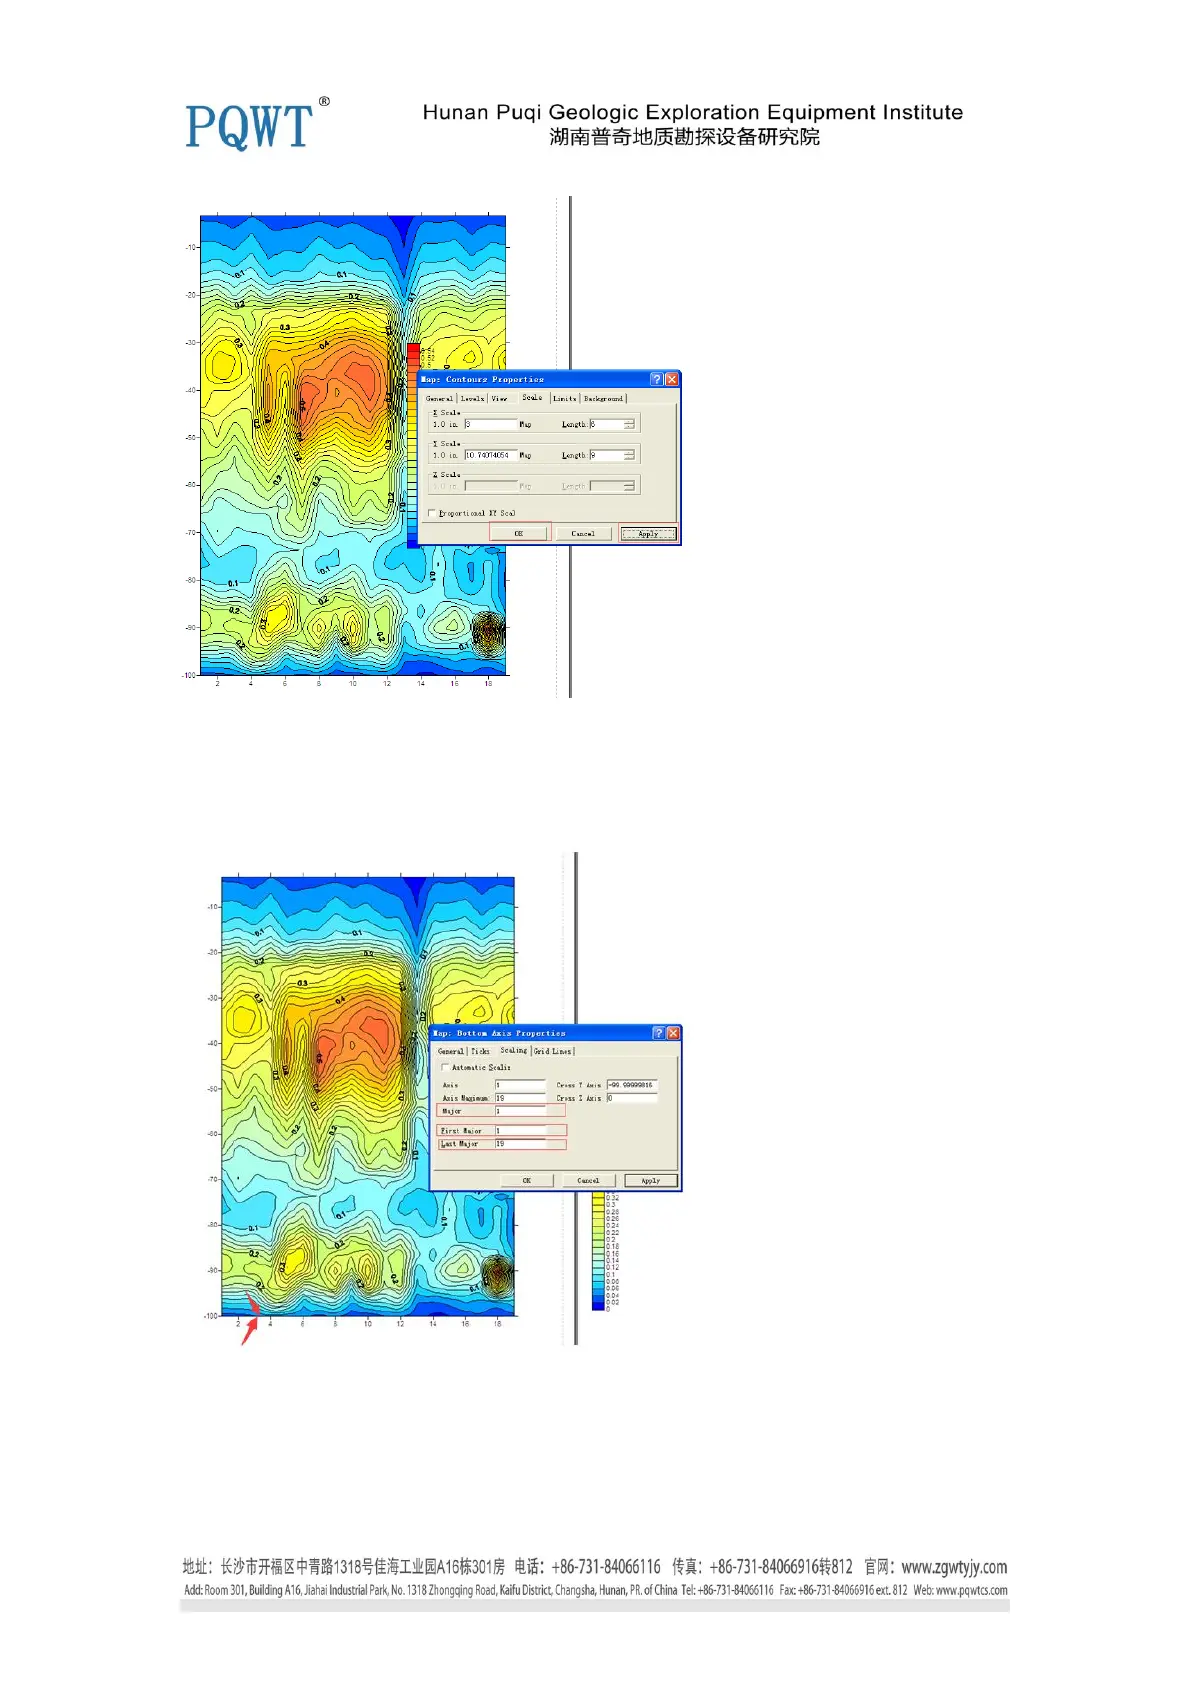
13. Double click x-axis, choose “ Scaling”, moify “Major and First Major” as 1, “ Last Major” 19,
as shown in figure 19.
Figure 19
11. Then click “ok”, here Contour Map is finished as shown in figure 20. The data of Y-axis is the
detection depth, the data of X-axis is the detection points.
 Loading...