© 2017 Proceq SA 26
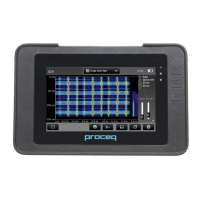
Tap to switch among
different views.
Figure 24: Multi-Line View with diameter values displayed (if measured)
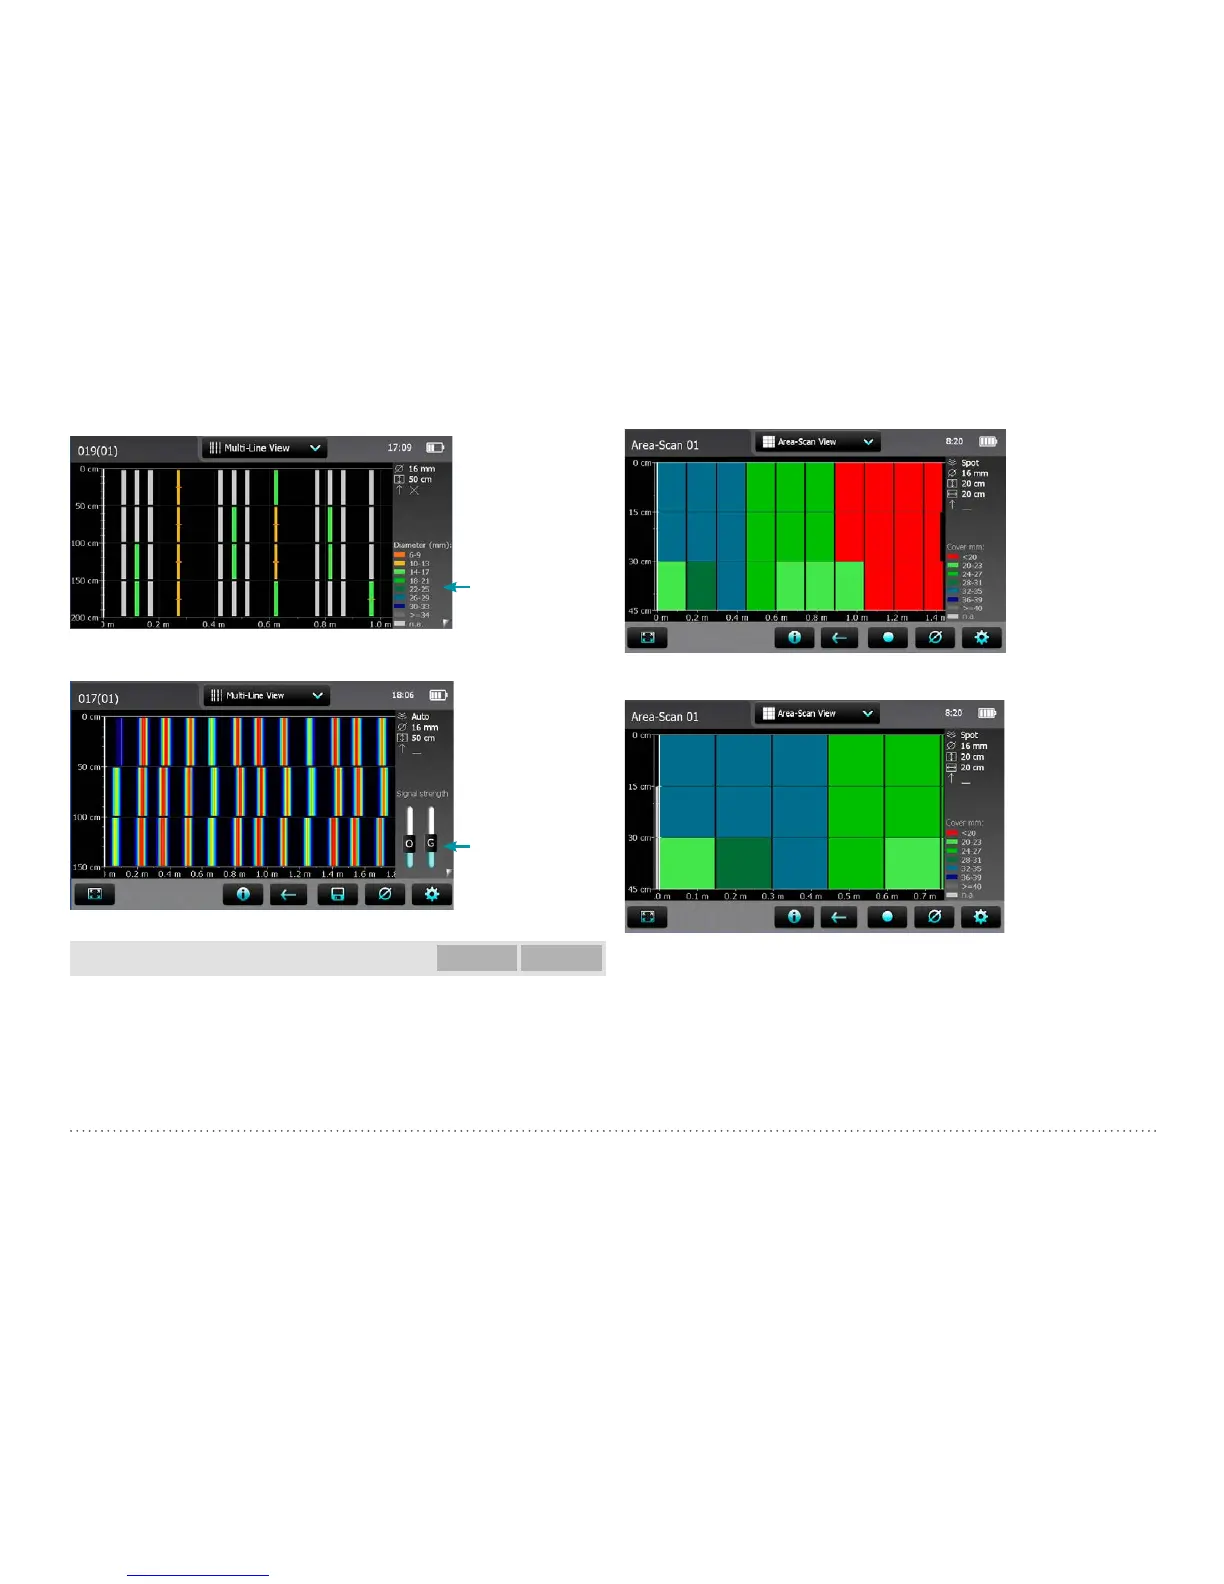
To sharpen the
color spectrum set
“Sharpen”
By changing the O-
and G-slider positions
the color spectrum
can be changed (see
Cross-Line View).
Tap to switch among
different views.
Figure 25: Multi-Line View with Signal Strength color spectrum
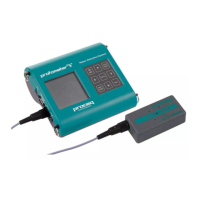
Area-Scan View
Profometer
630 AI
Profometer
650 AI
The Area-Scan View is in fact a simplified Multi-Line View which only
shows the lowest cover values in a predefined grid. It is mainly used in
combination with potential field measurements; e. g. combined with Pro-
fometer Corrosion measurements. Erroneous or non valid readings can be
masked and unmasked (see “3.2.2. Cover Meter Measurement Modes”);
a cross will appear into the masked fields and the corresponding cover
values will not be taken into account in the Statistical View.
Figure 26: Area-Scan View (X- and Y-axis with different scale)
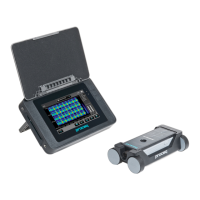
Figure 27: Area-Scan View (zoomed to show X- and Y-axis in the same
scale)