27 © 2017 Proceq SA
Cross-Line View
Profometer
650 AI
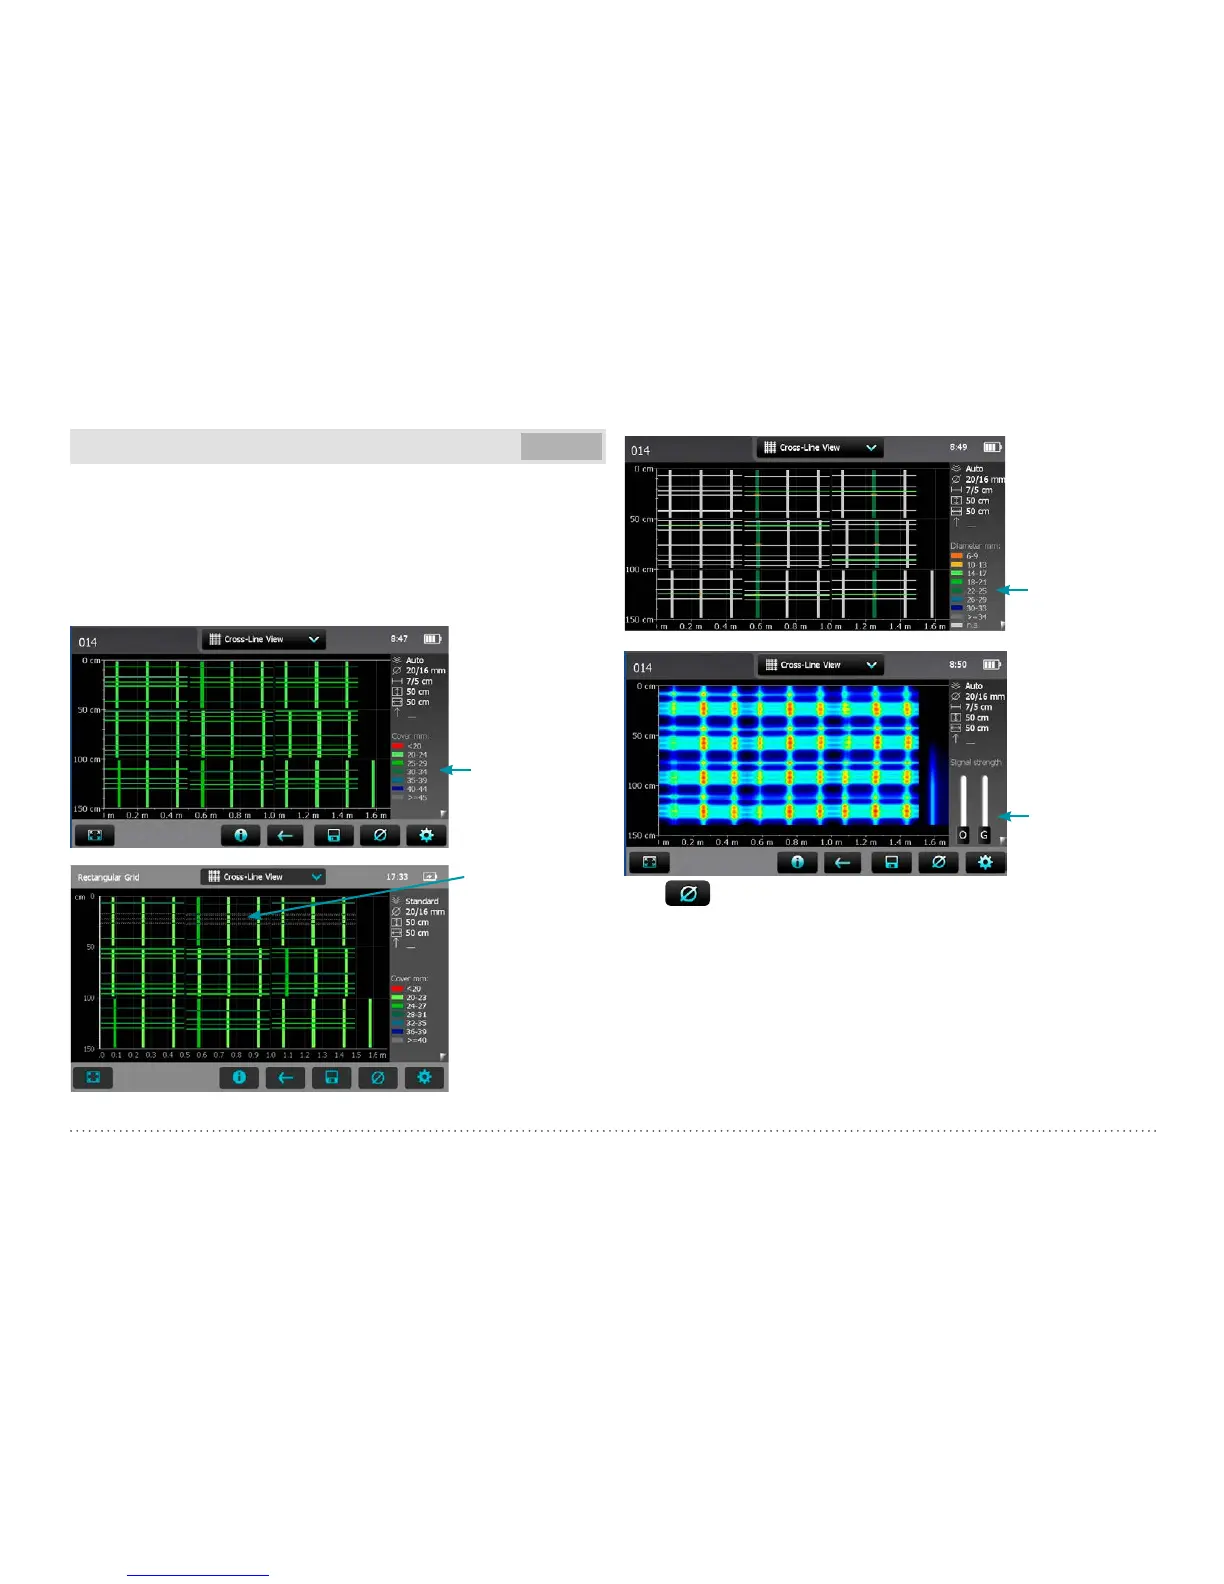
The Cross-Line View can be displayed only if measurements have been
done and stored in the Cross-Line Mode. It is a plan view of the first
and second layer rebars. Rebars can be masked and unmasked in the
corresponding Single-Line View (see “3.2.2. Cover Meter Measurement
Modes”); masked rebars will be displayed in dark grey with a dotted line
and their cover values will not be taken into account in the Statistical
View.
Tap to switch among
different views.
Masked rebars
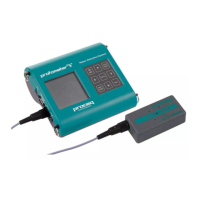
Tap to switch among
different views.
Two diameters and two NRC-
spacings (if set) are shown.
Left of / it’s the value of the
SX (scanning in X-direction
of the rebars running in
Y-direction), right of / it’s the
value of the SY (scanning
in Y-direction of the rebars
running in X-direction).
Either cover, diameter or
signal strength spectrum is
displayed.
Tap to switch among
different views.
Tap on
to change the global diameter of the active layer (SX or SY)
Figure 28: Cross-Line Views: Cover, Diameter, Signal Strength
In the signal strength spectrum view two sliders are shown on the right.
• With the O-slider (Offset) the signal strength range is set (from full
actual signal strength range to higher strength only).
• With the G-slider (Gain) the signal strength resolution is set. The
signal strength is accordingly displayed in colors from full color
spectrum to part of it only, e. g. blue to violet only.