QA402 User Manual
14
If you wish to add a title to your graph, that can also be done in the Add Measurement dialog in the text box
at the bottom of the dialog. You can specify up to four lines of 80 characters each.
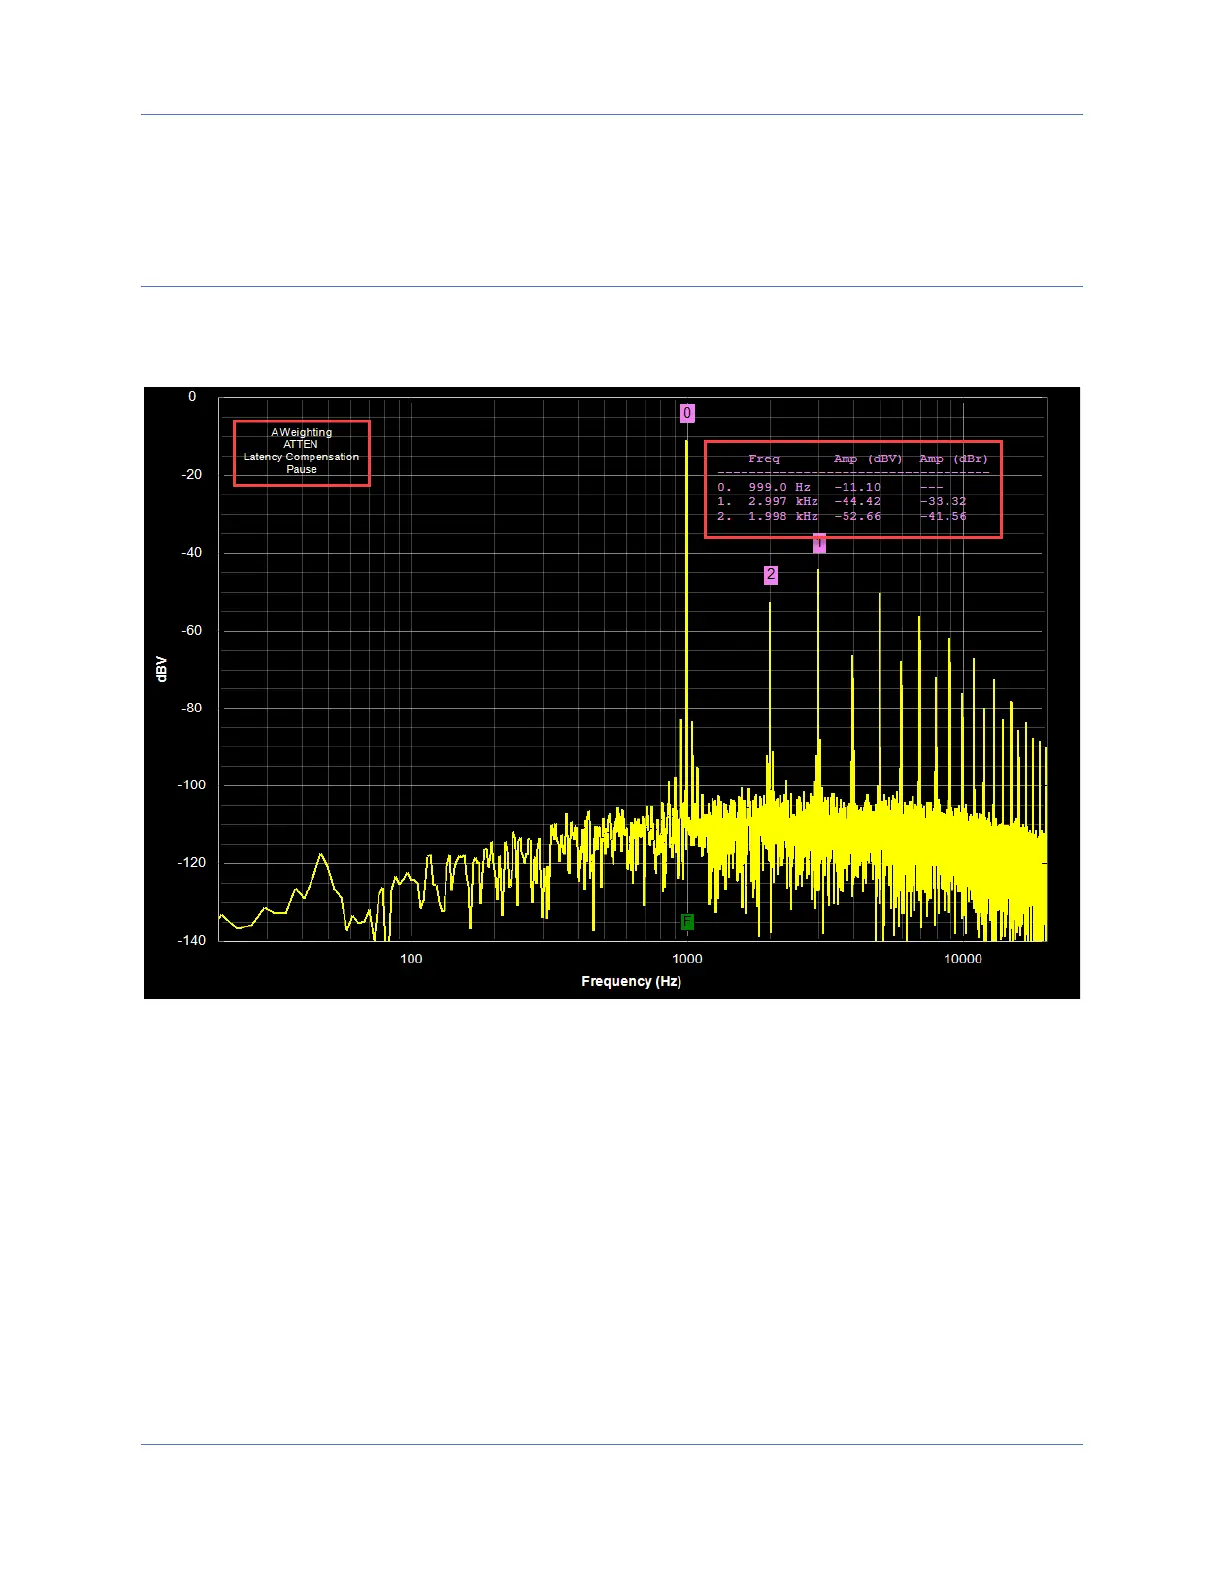
Trace Display Area
The graph display area can have a few areas of added information, in addition to the measurement traces.
These are highlighted below by the red boxes. On the left are the system annunciators. On the right are the
markers.
Markers
Markers can be added to the plot by right clicking on a peak. The markers are always sorted from highest
amplitude, and the tabular display will convey both absolute value and relative value referenced to marker 0
(the highest peak).
Markers can be removed by right clicking on the graph and selecting “Remove all Markers” or by pressing the
D key.
When placing markers on tones that are close in frequency to other tones, it can be helpful to click and drag a
zoom window, place the marker, and then zoom back out.
System Annunciators
System annunciators are short messages to convey special modes of operation, and they will appear in the
upper left corner of the graph. The complete list of annunciators that may be displayed are below: