iiiiiiiiiiiiiiiiiiiiiiiiiiiiiiiiiiiiiiiiiiiiiiiiiiiiiiiiiiiiiiiiiiiiiiiiiiiiiiiiiiiiiiiiiiiiiiiiiiiiiiiiiiiiiiiiiiiii RCA WO-33A Cathode-Ray Oscilloscope
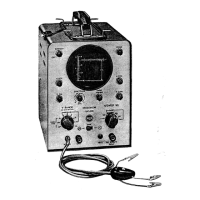
Figure 13. Color.TV signals
as
displayed
by
WO·33A. (A) Com.
posite
eolor·TV signal.
Color-burst
ean
be
seen
to
left
of
syne
pulse. (B)
Output
signal from RCA WR-61A Color-Bar
Generator
showing color-sync pulses
and
10
color-bar
pulses.
General Applications
Square-
Wave
Testing
of
Audio
Amplifiers
The
use of square waves for testing
the
charac-
teristics of audio equipment has distinct advantages
over other methods. A square-wave generator
and
the
WO-33A Oscilloscope,
when
set
up
as shown
in
Figure 14,
can
provide a quick
and
accurate means
of checking
an
amplifier
and
its adjustments.
In
this
test setup, it
is possible
to
check simultaneously the
amplitude, phase,
and
frequency characteristics of
the
amplifier.
The
value of
the
load resistance used depends
upon
the
output
impedance of
the
amplifier.
It
is
important
that
the
correct value
be
used.
For
an
over-all check of amplifier response,
the
WO-33A
should
be
connected directly across
the
load re-
sistance, as shown.
It
is desirable to employ square waves of
at
least
two fundamental frequencies.
The
lowest funda-
mental frequency should
be
equal to approximately
ten times
the
low-frequency limit of the amplifier
being tested. A 100-cycle square wave should serve
to check response from a few cycles to over
1000.
If
a square wave having a fundamental frequency
of 2 Kc
is
used,
the
amplifier may be checked
through
the balance of
the
audible range.
The square-wave generator should be set to
the
proper frequency
and
connected to
the
regular
input
terminal of
the
amplifier.
The
WO-33A
may
be
connected temporarily directly across the generator
for a reference check of
the
waveform.
The
WO-
33A may
then
be
connected to various points
in
the
amplifier to determine how each stage
is
functioning.
The effect of various adjustments may be seen
on
the screen.
Care should
be
taken to prevent too large a signal
from
the
square-wave generator from overloading
the amplifier
and
causing distortion of the
square
wave.
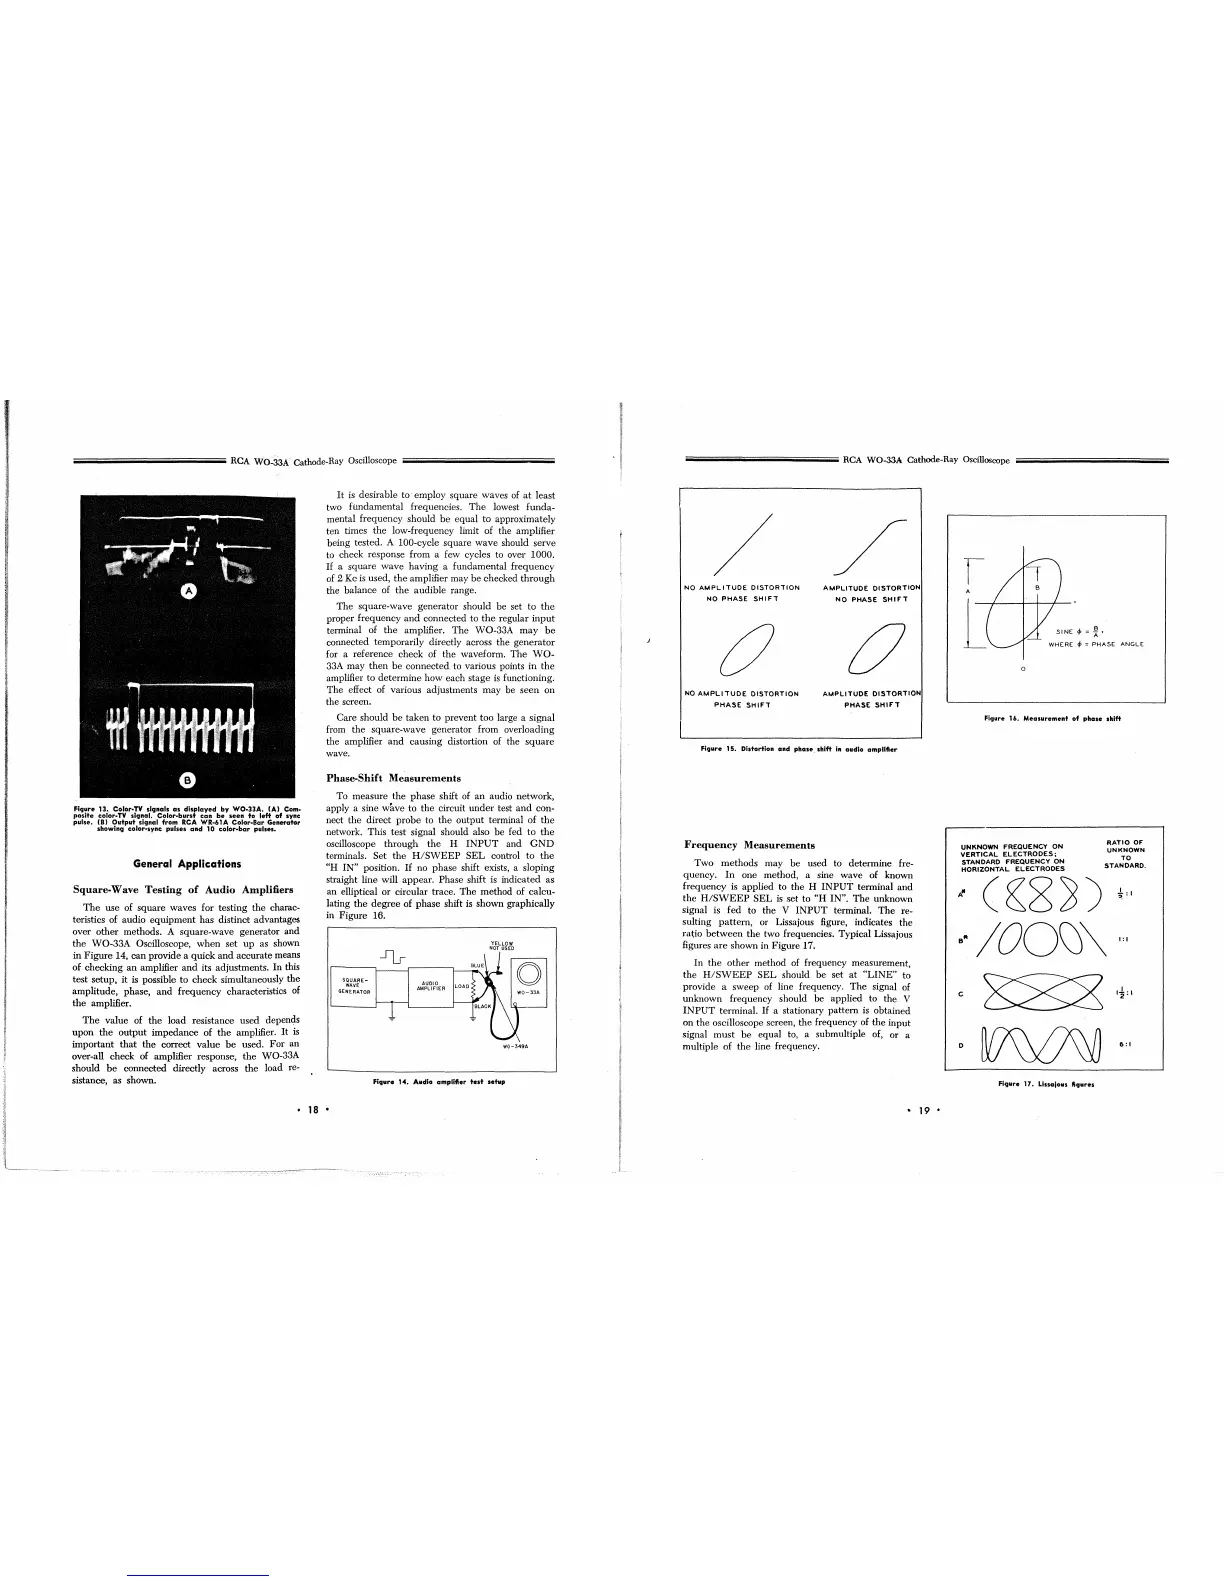
Phase-Shift
Measurements
To measure
the
phase shift of an audio network,
apply a sine
wave to the circuit
under
test
and
con-
nect
the
direct
probe
to
the
output
terminal of
the
network. This test signal should also be fed to
the
oscilloscope
through
the
H
INPUT
and
GND
terminals. Set
the
H/SWEEP
SEL
control to
the
"H
IN" position.
If
no phase shift exists, a sloping
straight line will appear.
Phase shift is indicated as
an elliptical or circular trace.
The
method of calcu-
lating
the
degree of phase shift is shown graphically
in Figure 16.
SQUARE-
WAVE
GENERATOR
AUDIO
AMPLIFIER
LOAD
YELLOW
NOT
USED
WG-349A
FICJure
14.
Audio amplifier
test
setup
• 18 •
iiiiiiiiiiiiiiiiiiiiiiiiiiiiiiiiiiiiiiiiiiiiiiiiiiiiiiiiiiiiiiiiiiiiiiiiiiiiiiiiiiiiiiiiiiiiiiiiiiiiiiiiiiiiiiiiiiiiiiiiii RCA WO-33A Cathode-Ray Oscilloscope
/
/
NO
AMPLITUDE
DISTORTION
AMPLITUDE
DISTORTION
NO
PHASE
SHIFT
NO
PHASE
SHIFT
C
0
NO
AMPLITUDE
DISTORTION
AMPLITUDE
DISTORTION
PHASE
SHIFl
PHASE
SHIFT
Figure 15. Distortion
and
phase. shift
in
audio amplifier
Frequency
Measurements
Two methods may be used to determine fre-
quency.
In
one method, a sine wave of known
frequency is applied to the H
INPUT
terminal and
the
H/SWEEP
SEL
is
set to
"H
IN".
The
unknown
signal is fed to the
V
INPUT
terminal.
The
re-
sulting
pattern,
or Lissajous figure, indicates the
ratio
between
the two frequencies. Typical Lissajous
figures
are
shown in Figure 17.
In
the
other method of frequency measurement,
the
H/SWEEP
SEL
should
be
set
at
"LINE"
to
provide a sweep of line frequency.
The
signal of
unknown frequency should be applied to the
V
INPUT
terminal.
If
a stationary pattern
is
obtained
on the oscilloscope screen,
the
frequency of the input
signal
must
be
equal to, a submultiple of, or a
multiple of
the
line frequency.
..
19 •
r
A
SINE
cp
=
~
•
[
WHERE
cp
= PHASE
ANGLE
0
Figure 16.
Measurement
of
phase
shift
UNKNOWN
FREQUENCY
ON
VERTICAL
ELECTRODES;
STANDARD
FREQUENCY
ON
HORIZONTAL
ELECTRODES
RATIO
OF
UNKNOWN
TO
STANDARD.
D
6:1
Figure 17. Llssalous
fiCJures
 Loading...