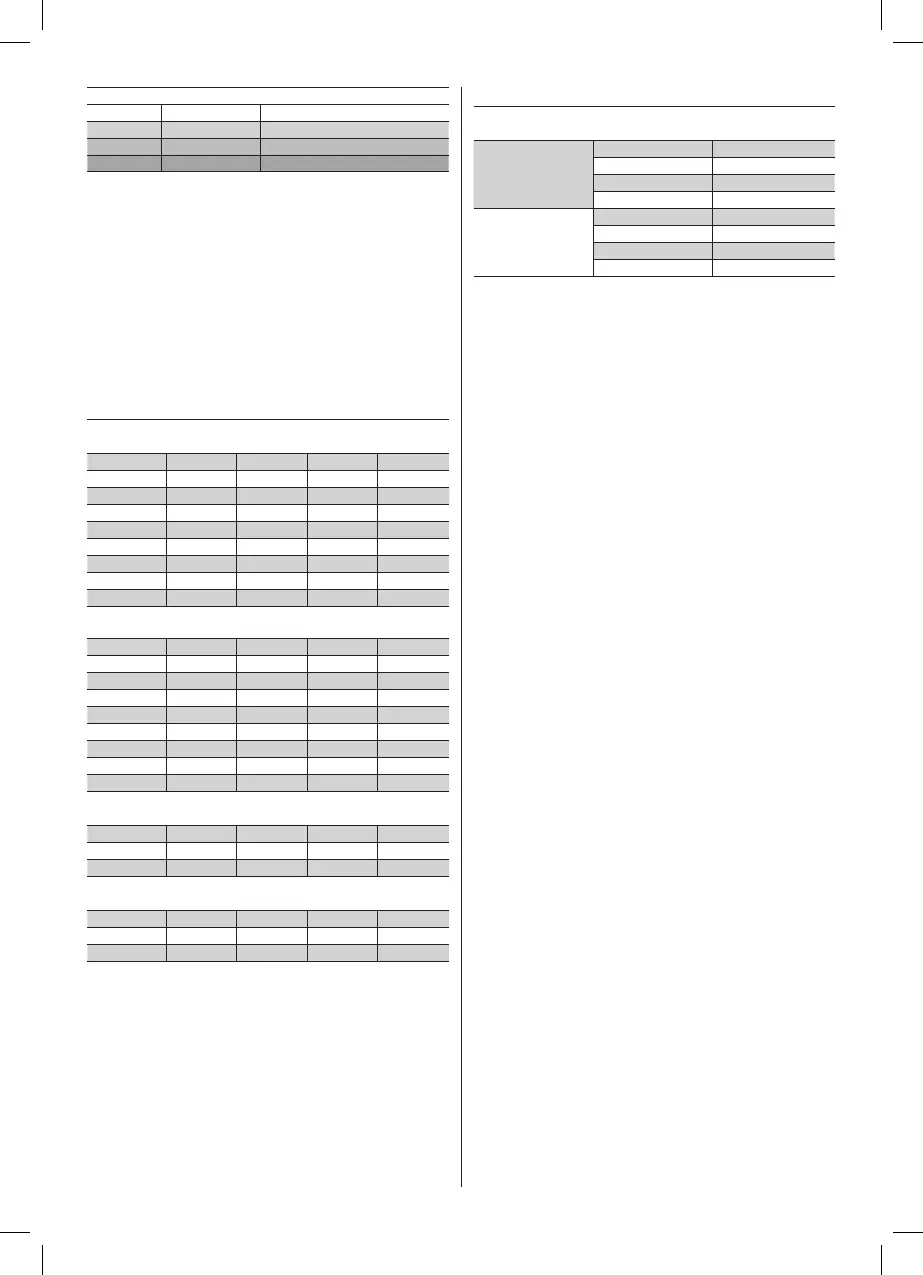
BMI Category BMI Value Meaning Health Risk Based Solely On BMI
< 18.5 Underweightt Moderate
18.6-24.9 Normal Low
25-29.9 Overweight Moderate
30+ Obese High
IMPORTANT: If the chart/table shows that you are outside of a ‘normal’ healthy
weight range, consult your doctor before taking any action. BMI classifications are for
adults (age 20+ years) only.
BODY FAT -WHAT DOES IT MEAN? The human body is made up of, amongst other
things, a percentage of fat. This is vital for a healthy, functioning body - it cushions
joints and protects vital organs, helps regulate body temperature, stores vitamins
and helps the body sustain itself when food is scarce. However, too much body fat
or indeed too little body fat can be damaging to your health. It is dicult to gauge
how much body fat we have in our bodies simply by looking at ourselves in the
mirror. This is why it is important to measure and monitor your body fat percentage.
Body fat percentage gives you a better measure of fitness than weight alone – the
composition of your weight loss could mean you are losing muscle mass rather
than fat - you could still have a high percentage of fat even when a scale indicates
‘normal weight’.
NORMAL HEALTHY RANGE OF BODY FAT PERCENTAGE
BODY FAT % RANGES FOR BOYS*
Age Low Optimal Moderate High
10 ≤12.8 12.9 - 22.8 22.9 - 27.8 ≥27.9
11 ≤12.6 12.7 - 23.0 23.1 - 28.2 ≥28.3
12 ≤12.1 12.2 - 22.7 22.8 - 27.8 ≥27.9
13 ≤11.5 11.6 - 22.0 22.1 - 26.9 ≥27.0
14 ≤10.9 11.0 - 21.3 21.4 - 25.8 ≥25.9
15 ≤10.4 10.5 - 20.7 20.8 - 24.9 ≥25.0
16 ≤10.1 10.2 - 20.3 20.4 - 24.2 ≥24.3
17 ≤9.8 9.9 - 20.1 20.2 - 23.8 ≥23.9
18 ≤9.6 9.7 - 20.1 20.2 - 23.5 ≥23.6
BODY FAT % RANGES FOR GIRLS*
Age Low Optimal Moderate High
10 ≤16.0 16.1 - 28.2 28.3 - 32.1 ≥32.2
11 ≤16.1 16.2 - 28.8 28.9 - 32.7 ≥32.8
12 ≤16.1 16.2 - 29.1 29.2 - 33.0 ≥33.1
13 ≤16.1 16.2 - 29.4 29.5 - 33.2 ≥33.3
14 ≤16.0 16.1 - 29.6 29.7 - 33.5 ≥33.6
15 ≤15.7 15.8 - 29.9 30.0 - 33.7 ≥33.8
16 ≤15.5 15.6 - 30.1 30.2 - 34.0 ≥34.1
17 ≤15.1 15.2 - 30.1 30.2 - 34.3 ≥34.4
18 ≤14.7 14.8 - 30.8 30.9 - 34.7 ≥34.8
BODY FAT % RANGES FOR MEN**
Age Low Optimal Moderate High
19 - 39 ≤8 8.1 - 19.9 20 - 24.9 ≥25
40 - 59 ≤11 11.1 - 21.9 22 - 27.9 ≥28
60+ ≤13 13.1 - 24.9 25 - 29.9 ≥30
BODY FAT % RANGES FOR WOMEN**
Age Low Optimal Moderate High
19 - 39 ≤21 21.1 - 32.9 33 - 38.9 ≥39
40 - 59 ≤23 23.1 - 33.9 34 - 39.9 ≥40
60+ ≤24 24.1 - 35.9 36 - 41.9 ≥42
*Source: Derived from; HD McCarthy, TJ Cole, T Fry, SA Jebb and AM Prentice: “Body fat reference
curves for children”. International Journal of Obesity (2006) 30, 598–602.
**Source: Derived from; Dympna Gallagher, Steven B Heymsfield, Moonseong Heo, Susan A Jebb,
Peter R Murgatroyd, and Yoichi Sakamoto: “Healthy percentage body fat ranges: an approach for
developing guidelines based on body mass index1–3”. Am J Clin Nutr 2000;72:694–701.
The Body Fat % ranges published are for guidance only. Professional medical guidance should
always be sought before embarking on diet and exercise programs.
BODY WATER -WHY MEASURE IT? Body water is the single most important
component of body weight. It represents over half of your total weight and almost
two thirds of your lean body mass (predominantly muscle). Water performs a
number of important roles in the body: All the cells in the body, whether in the skin,
glands, muscles, brain or anywhere else, can only function properly if they have
enough water. Water also plays a vital part in regulating the body’s temperature
balance, particularly through perspiration. The combination of your weight and fat
measurement could appear to be ‘normal’ but your body hydration level could be
insucient for healthy living.
NORMAL HEALTHY RANGE OF BODYWATER PERCENTAGE
BODY WATER CHART***
BF % Range Optimal BW % Range
Men
4 to 14% 70 to 63%
15 to 21% 63 to 57%
22 to 24% 57 to 55%
25 and over 55 to 37%
Women
4 to 20% 70 to 58%
21 to 29% 58 to 52 %
30 to 32 % 52 to 49%
33 and over 49 to 37%
***Source: Derived from Wang & Deurenberg: “Hydration of fat-free body mass”. American Journal
Clin Nutr 1999, 69 833-841.
For those using Athlete Mode: note that athletes may have a lower body fat range
and a higher body water range than shown above, depending on their type of sport
or activity. Body water measurement results are influenced by the proportion of body
fat and muscle. If the proportion of body fat is high, or the proportion of muscle is
low then the body water results will tend to be low. It is important to remember that
measurements such as body weight, body fat and body water are tools for you to use
as part of your healthy lifestyle. As short term fluctuations are normal, we suggest
you chart your progress over time, rather than focus on a single days reading.
The Body Water % ranges published are for guidance only. Professional
medical guidance should always be sought before embarking on diet and
exercise programmes.
WHY SHOULD I KNOW MY MUSCLE MASS? According to the American College of
Sports Medicine (ASCM), lean muscle mass may decrease by nearly 50 percent
between the ages of 20 and 90. If you don’t do anything to replace that loss you’re
losing muscle and increasing fat. It is also important to know your muscle mass
% during weight reduction. At rest, the body burns approximately 110 additional
calories for each kilo of muscle gained. Some advantages of gaining muscle mass
include:
• Reversing the decline in strength, bone density and muscle mass that
accompanies age
• Maintenance of flexible joints
• Guide weight reduction when combined with a healthy diet.
This product is for domestic use only. Pregnant women should only use the weight
function.
CAUTION : Do not use this product if you have a pacemaker or other medical
device fitted. If in doubt, consult your doctor.
QUESTIONS & ANSWERS For a full list of MiBody frequently asked questions please
visit www.mibody.co.uk/help or click “About” from the “Settings” page of the MiBody
App.
How exactly is my body fat and water being measured?
This Salter Scale uses a measurement method known as Bioelectrical Impedance
Analysis (BIA). A minute current is sent through your body, via your feet and legs.
This current flows easily through the lean muscular tissue, which has a high fluid
content, but not easily through fat. Therefore, by measuring your body’s impedance
(i.e. its resistance to the current), the quantity of muscle can be determined. From
this, the quantity of fat and water can then be estimated.
What is the value of the current passing through me when the measurement is
taken? Is it safe?
The current is less than 1mA, which is tiny and perfectly safe. You will not be able
to feel it. Please note however, that this device should not be used by anyone with
an internal electronic medical device, such as a pacemaker, as a precaution against
disruption to that device.
If I measure my body fat and water at dierent times during the day, it can
vary quite considerably. Which value is correct?
Your body fat percentage reading varies with body water content, and the latter
changes throughout the course of the day. There is no right or wrong time of the day
to take a reading, but aim to take measurements at a regular time when you consider
your body to be normally hydrated. Avoid taking readings after having a bath or
sauna, following intensive exercise, or within 1-2 hours of drinking in quantity or
eating a meal.
My friend has a Body Fat Analyser made by another manufacturer.
When I used it I found that I got a dierent body fat reading. Why is this?
Dierent Body Fat Analysers take measurements around dierent parts of the body
and use dierent mathematic algorithms to calculate the percentage of body fat.
The best advice is to not make comparisons from one device to another, but to use
the same device each time to monitor any change.
2
 Loading...