Do you have a question about the SCIEX PA 800 Plus and is the answer not in the manual?
Introduces the PA 800 Plus Methods Development Guide and its purpose.
Provides guidance on accessing and utilizing provided sample data files for exercises.
Explains the intended use of tutorial data and method files for training purposes.
Details the steps for making copies of sample files before use to maintain originals.
Describes common CE modes and their performance on the PA 800 Plus instrument.
Explains the PA 800 Plus system's use of capillaries and detection methods (UV, PDA, LIF).
Details CZE principles, including voltage application, migration, and electroosmotic flow (EOF).
Explains MEKC for separating neutral molecules using micellar additives in the electrolyte.
Describes CGE, which uses increased viscosity media to impede molecule migration based on size.
Details cIEF, which uses pH gradients to separate molecules based on isoelectric points.
Explains CEC, a technique using packed capillaries for separation driven by EOF.
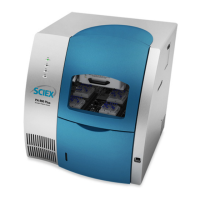
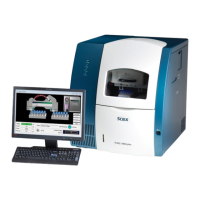
Lists main components of the PA 800 Plus system, including sample trays and optics.
Describes the system's tray configuration for samples and buffer solutions.
Explains the function and design of the capillary cartridge protecting the separation capillary.
Details the syringe pump, high voltage supply, and safety interlocks for instrument operation.
Describes the UV light source, filters, and optics path for UV detection.
Explains PDA detection, spectral analysis, and its components like gratings and photodiodes.
Details the LIF detector system, its laser module, and fluorescence detection principles.
Describes the 488 nm laser module and its interface with the PA 800 Plus instrument.
Guides users on how to launch the 32 Karat software from the Windows Start menu.
Explains the functions and access methods for tool bar and menu bar commands.
Details steps for creating and configuring instrument connections for data acquisition.
Describes the automated process for configuring the PA 800 Plus module in the software.
Covers settings for analysis options like PDA, System Suitability, Qualitative Analysis.
Explains how to select operating modes like Standard CE or CEC/LC within instrument settings.
Guides manual setup for UV, PDA, and LIF detectors when hardware is offline or in use.
Introduces Direct Control as an interface for immediate parameter adjustment and troubleshooting.
Explains how to access the Direct Control window and its graphical interface.
Provides a step-by-step exercise for conditioning a bare fused-silica capillary using Direct Control.
Introduces methods as automated sequences for instrument operation and data analysis.
Details the process of creating or editing an instrument method within the 32 Karat software.
Explains setting initial instrument parameters like voltage, current, and temperature before separation.
Guides setting up initial conditions specific to UV, PDA, and LIF detectors.
Describes creating a sequence of timed events for automated method execution.
Emphasizes the importance of saving the created or edited method to preserve work.
Explains running methods in Single Run or Sequence modes for sample analysis.
Details the process of performing a single analysis run using a pre-defined method.
Guides creating sequences for automated, multi-sample acquisition or batch reprocessing.
Explains how to execute a programmed sequence of runs on the instrument.
Describes the software's validation of methods against instrument configuration before a run.
Defines integration as determining peak start, stop, baseline, and area in an electropherogram.
Covers basic peak integration using width and threshold parameters in the software.
Explains adjusting integration parameters like threshold and width for accurate peak detection.
Details methods for integrating poorly resolved peaks or peak clusters effectively.
Describes turning off integration for specific regions to exclude baseline artifacts or noise.
Discusses generating reports from integration results for analysis and identification.
Explains the importance of translating peak parameters into component identification and quantity.
Differentiates qualitative (component ID) and quantitative (component amount) analysis.
Guides on preparing data files and methods for calibration curve generation.
Details building a new method specifically for calibrating data sets.
Explains using sequences to reprocess data and generate calibration curves for unknowns.
Covers comparing unknown sample data against a standard curve to determine component amounts.
Explains constructing standard curves based on molecular quality for component identification.
Defines mobility as a parameter quantifying particle migration in an electrical field.
Emphasizes the need for a mobility marker for calculations and reproducibility.
Details the steps for assigning mobility values to markers and calculating electrophoretic mobility.
Describes creating and interpreting electropherograms with the X-axis scaled in mobility.
Provides a step-by-step example of using mobility features for peak identification.
Explains using mobility and windows to identify peaks based on standard mobilities.
Introduces the software's utilities for creating printed reports and exporting data.
Guides on creating custom reports and modifying existing report templates.
Guides on creating custom reports and modifying existing report templates.
Details saving reports as templates for reuse in other methods or as default reports.
Details saving reports as templates for reuse in other methods or as default reports.
Lists standard, method custom, and sequence custom report templates available.
Lists standard, method custom, and sequence custom report templates available.
Lists standard, method custom, and sequence custom report templates available.
Lists standard, method custom, and sequence custom report templates available.
Lists standard, method custom, and sequence custom report templates available.
Identifies the online help as the primary reference for software features and advanced functions.
Points to the System Maintenance Guide for hardware and maintenance related questions.
Advises contacting SCIEX Field Service for instrument problems not resolved by the manual.
Suggests publications, libraries, and the SCIEX website for further information.
Notes similarities and differences between CE and chromatographic data processing.
Explains the relationship between Voltage, Current, and Resistance in capillary electrophoresis.
Provides the formula for calculating corrected migration time using reference peaks.
Explains how corrected peak area eliminates bias caused by differences in migration speed.
Details calculating apparent mobility and electrophoretic mobility, including EOF.
Introduces PDA data components: Channel, 3D spectral, and Multi-Electropherogram data.
Describes different ways to view PDA data: Mixed, Contour, Spectrum, Electropherogram, 3D Plot.
Explains System Administration functions for managing users, projects, and instruments.
Defines vial incrementing as an automated process for advancing vial positions during runs.
Illustrates vial incrementing with practical examples for method and sequence setup.
Introduces the Sequence Vial Report for summarizing vial usage in sequences.
Describes the preview report showing vial usage based on sequence table methods.
Explains the confirmed report detailing successfully used vial combinations after sequence execution.
| Category | Capillary Electrophoresis System |
|---|---|
| Manufacturer | SCIEX |
| Model | PA 800 Plus |
| Operating Temperature | 15°C to 35°C |
| Data Acquisition Rate | Up to 100 Hz |
| Voltage | 100-240 VAC |
| Frequency | 50/60 Hz |
| Detection Methods | Conductivity |
| Sample Capacity | Up to 96 samples (autosampler) |
| Voltage Range | Up to 30 kV |
| Capillary Length Options | 10-100 cm |
| Weight | 45 kg (100 lbs) |