17
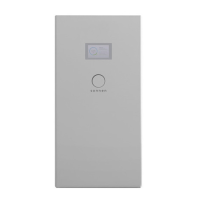
Consumption Pie Chart
The Consumption graph indicates how much
energy was consumed in your home overall, as
well as the proportion this energy that was self-
produced, or purchased from the grid.
The section labeled ‘Self Production
Autarky’ represents the proportion of home
energy consumption that was stored in your
sonnenBatterie and produced by your solar system
– your solar self-consumption. The section labeled
‘Additional purchase’ represents the proportion
of home energy consumption purchased from the
grid.
Self-Consumption Mode Use Case
This section will provide an example of a typical
history graph for a sonnenBatterie set to self-
consumption mode.
*Note that this view period is set to Week, although it can be
set to Day, Week, Month, and Year.
As a reminder, in this graph, the yellow spikes
represent how much PV you are producing, the
blue represents your home’s energy consumption,
and the red represents battery discharge. The
purple line that moves up as the battery charges
and down as the battery discharges is called the
State of Charge. This is like a ‘fuel gauge’ for the
battery.
In the weekly graph above, you can see
the transition from day to night as the PV
production reading rises and falls in daily cycles.
Correspondingly, the sonnenBatterie begins to
charge during the day, as shown by the green area.
In this example, on the sunnier days, the home
solar array produces much more energy than can
be stored in the solar battery or consumed by the
home. This extra energy would be fed back into
the grid or dissipated.
The home energy consumption in blue is
relatively constant throughout the day with a
large spike in the evening after the sun sets.
However, this blue consumption is mainly covered
in red, indicating that the sonnenBatterie began
discharging once the sun set to cover the energy
consumption.
There is a brief period at night when
consumption is not covered by the sonnenBatterie
or home solar. As a homeowner, this could be
fixed by getting a larger storage system, reducing
consumption, or shifting load use to the middle of
the day when excess solar is being produced.
In addition, the most telling feature that the
sonnenBatterie is in self-consumption mode is
the daily rise and fall of the unit’s State of Charge.
The State of Charge rises as the battery charges
using solar energy produced throughout the day
and falls as the battery discharges to meet home
energy use demands.
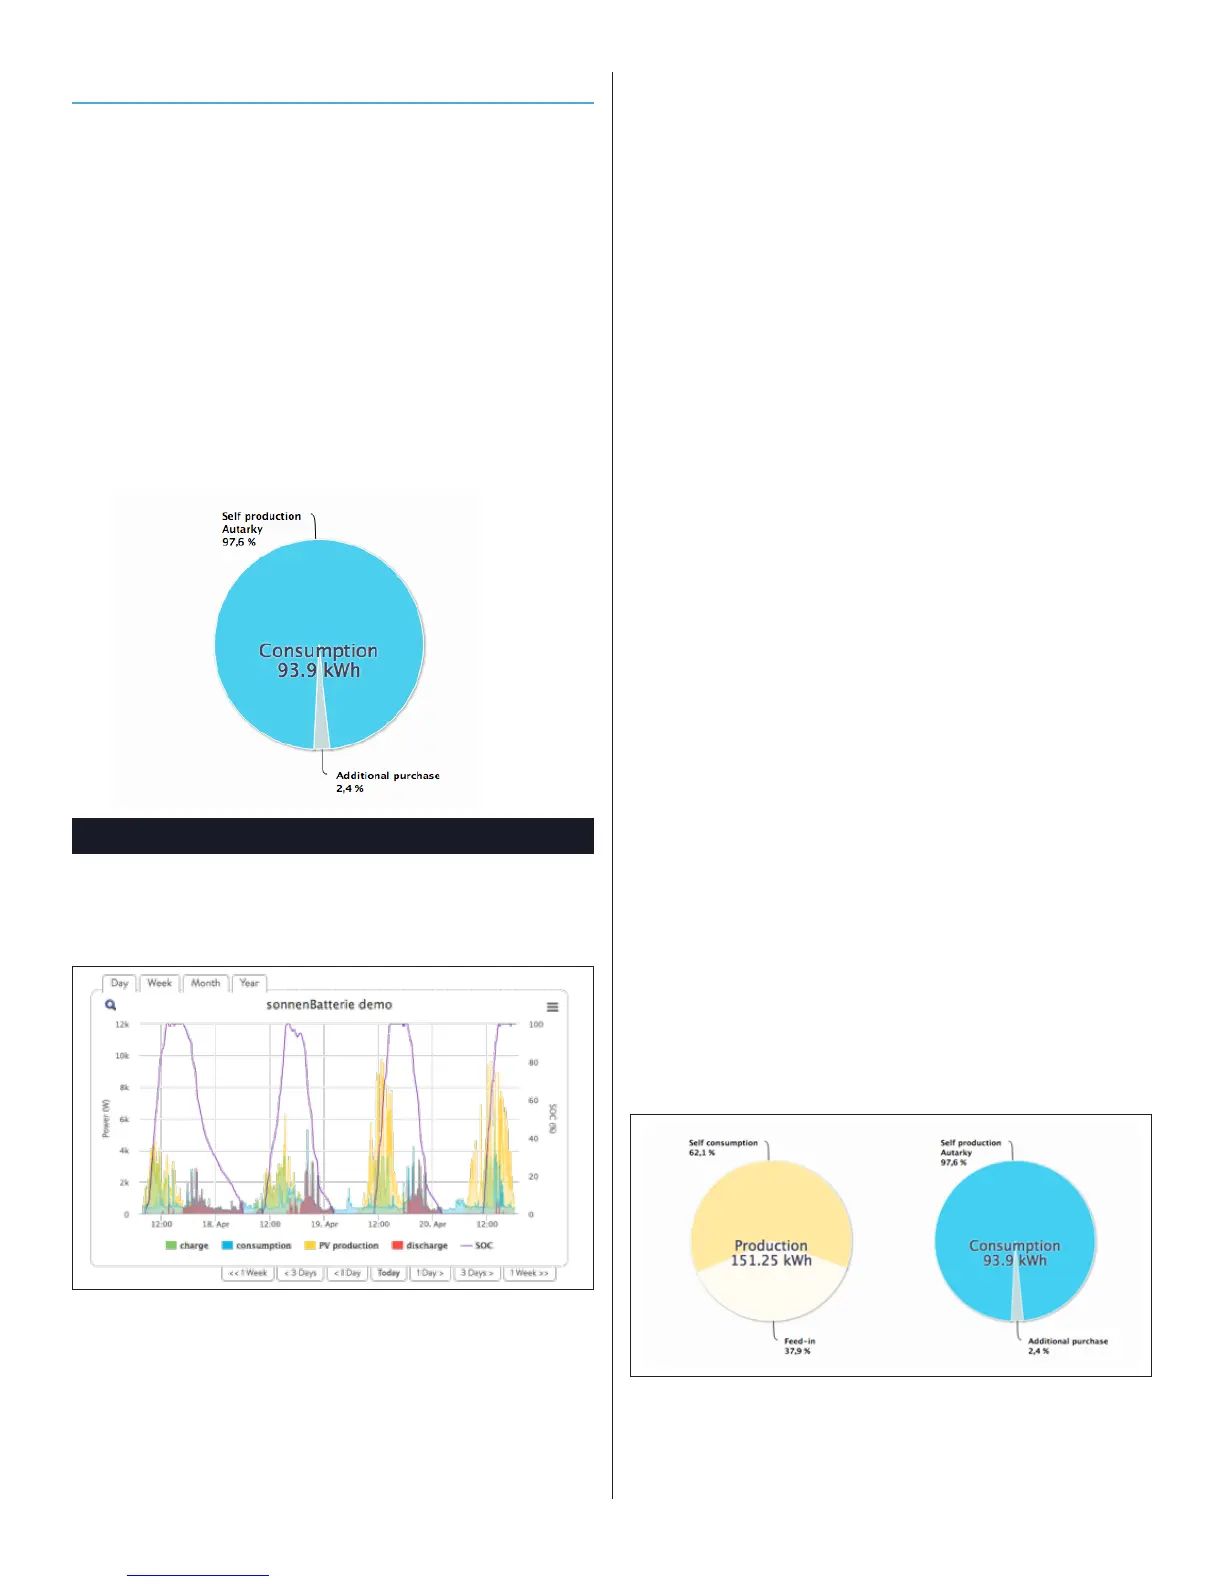
Underneath this graph are the Production
and Consumption pie charts, which show how
much of your own energy you are producing and
consuming respectively.
 Loading...