6
G
RAPHING
T
ECHNOLOGY
G
UIDE
: TI-82
Copyright © Houghton Mifflin Company. All rights reserved.
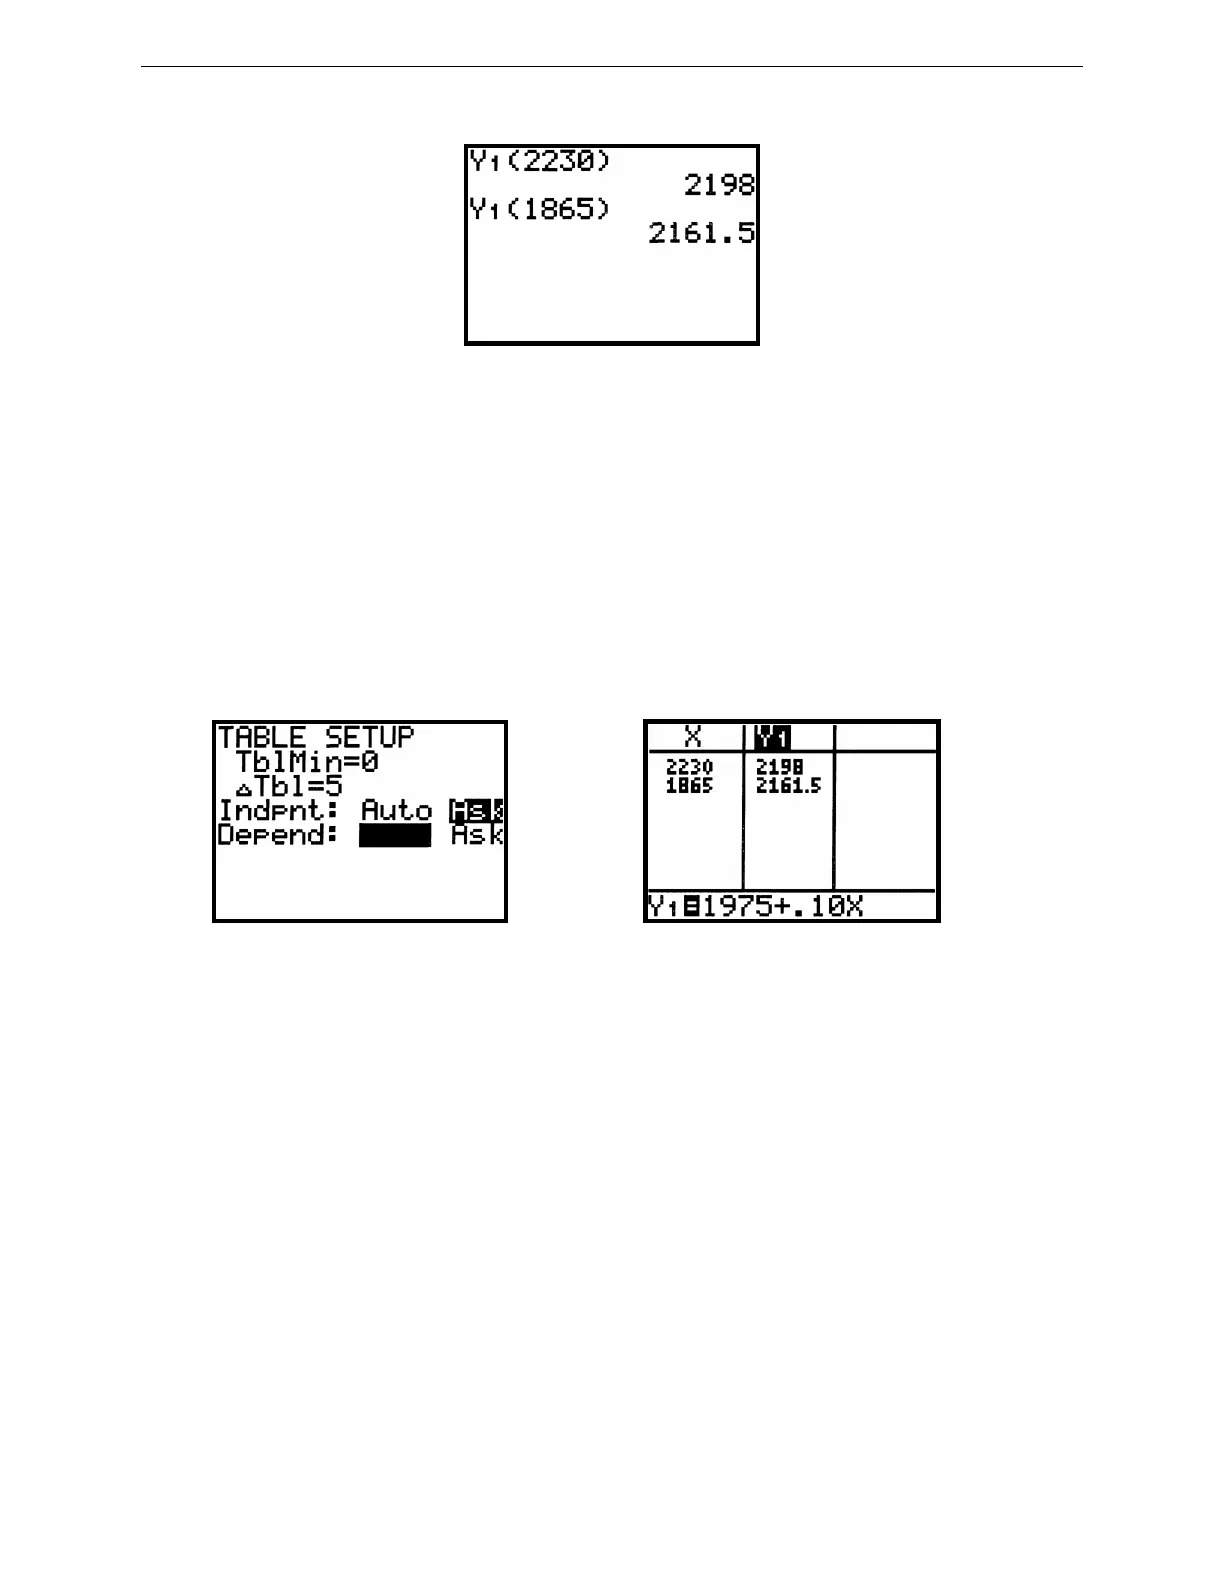
Figure 2.8: Function notation
It is not necessary to repeat all these steps to find the February wages. Simply press 2nd ENTRY to recall the entire
previous line and change 2230 to 1865. Each time the TI-82 evaluates the function Y
1
, it uses the current value of x.
Like your textbook, the TI-82 uses standard function notation. So to evaluate Y
1
(2230) when Y
1
(x) = 1975 + .10x,
press 2nd Y-
VARS
1 1 ( 2230 ) ENTER (see Figure 2.8). Then to evaluate Y
1
(1865), press 2nd ENTRY to recall
the last line and change 2230 to 1865.
You may also have the TI-82 make a table of values for the function. Press 2nd TblSet to set up the table (Figure
2.9). Move the blinking cursor onto Ask beside Indpnt:, then press ENTER. This configuration permits you to input
values for x one at a time. Now press 2nd TABLE, enter 2230 in the x column, and press ENTER (see Figure 2.10).
Continue to enter additional values for x and the calculator automatically completes the table with corresponding
values of Y
1
. Press 2nd QUIT to leave the TABLE screen.
Figure 2.9: TbISet screen Figure 2.10: Table of values
For a table containing values for x = 1, 2, 3, 4, 5, and so on, set TblMin = 1 to start at x = 1, ∆Tbl = 1 to increment in
steps of 1, and both Indpnt and Depend to Auto.
Technology Tip: The TI-82 does not require multiplication to be expressed between variables, so xxx means x
3
. It is
often easier to press two or three x’s together than to search for the square key or the cube operation. Of course,
expressed multiplication is also not required between a constant and a variable. Hence to enter 2x
3
+ 3x
2
– 4x + 5 in
the TI-82, you might save keystrokes and press just these keys: 2
X,T,θ
X,T,θ
X,T,θ
+ 3
X,T,θ
X,T,θ
– 4
X,T,θ
+ 5.
2.2.2 Functions in a Graph Window: Once you have entered a function in the Y= screen of the TI-82, just press
GRAPH to see its graph. The ability to draw a graph contributes substantially to our ability to solve problems.
For example, here is how to graph y = –x
3
+ 4x. First press Y= and delete anything that may be there by moving with
the arrow keys to Y
1
, or to any of the other lines and pressing CLEAR wherever necessary. Then, with the cursor on
the top line Y
1
, press (-)
X,T,θ
MATH 3 + 4
X,T,θ
to enter the function (as in Figure 2.11). Now press GRAPH and
the TI-82 changes to a window with the graph of y = –x
3
+ 4x.
While the TI-82 is calculating coordinates for a plot, it displays a busy indicator at the top right of the graph
window.