16 Discovering Algebra Calculator Notes for the Texas Instruments TI-83 and TI-83/84 Plus ©2007 Key Curriculum Press
Note 1F • Scatter Plots (continued) TI-83 and TI-83/84 Plus
(continued)
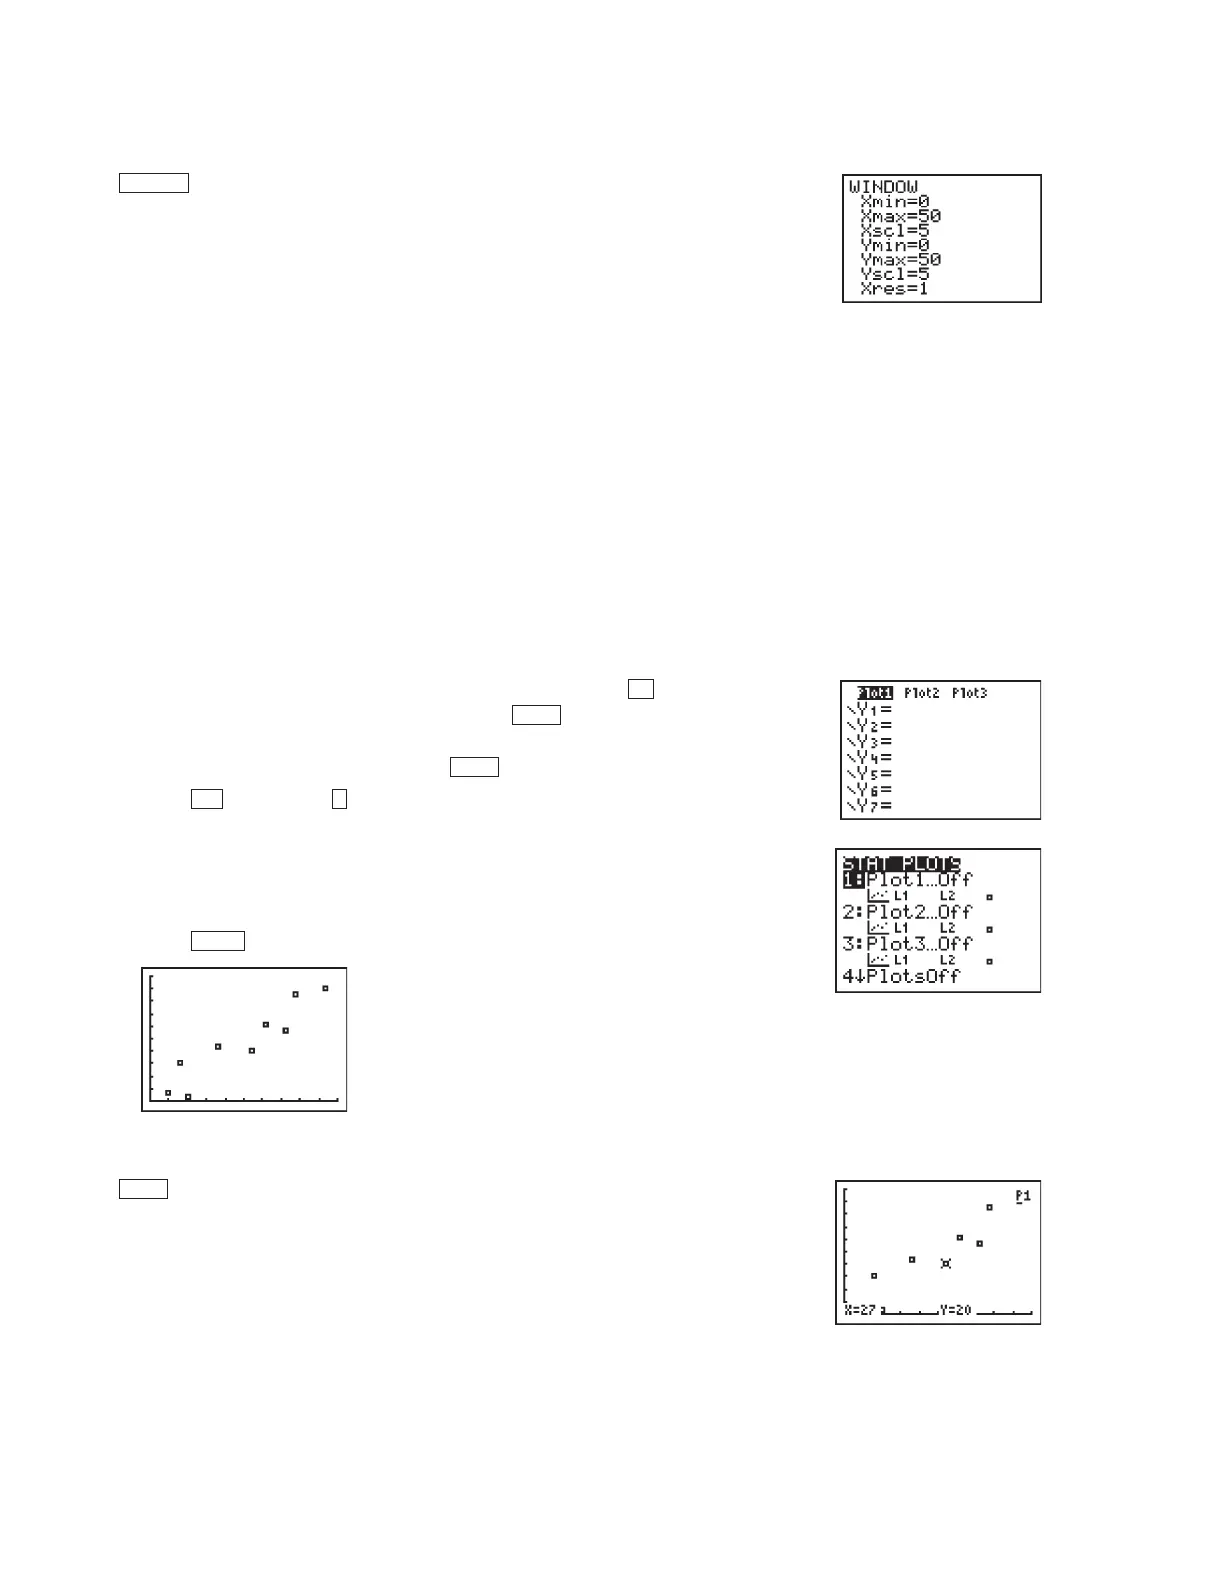
Setting the WINDOW Values
Press and enter the following values into the WINDOW screen.
Xmin a number less than the minimum value in the list of x-coordinates.
Xmax a number greater than the maximum value in the list of
x-coordinates.
Xscl the distance between tick marks. You can use 0 (no tick marks) or a
value usually less than or equal to
Xmax
1
0
Xmin
.Ifyour Xscl value is
too small, the x-axis will appear too thick.
Ymin a number less than the minimum value in the list of y-coordinates.
Ymax a number greater than the maximum value in the list of
y-coordinates.
Yscl the distance between tick marks. You can use 0 (no tick marks) or a
value usually less than or equal to
Ymax
1
0
Ymin
.Ifyour Yscl value is
too small, the y-axis will appear too thick.
Xres 1. This number does not affect a scatter plot.
Displaying the Scatter Plot
a. Clear or turn off any equations in the Y screen. (Press . Place the
cursor anywhere in an equation and press to delete the equation.
Or, move the cursor over the highlighted equal sign of any equation
you don’t want to delete, and press to turn off the equation.)
b. Press
[STAT PLOT] (Plot1...). (You can choose any of the three
stat plots.)
c. Select
On, ScatterPlot, L1 for Xlist (if your x-coordinates are in list L1);
L2 for Ylist (if your y-coordinates are in list L2), and choose a mark type
to indicate the data points.
d. Press .
Tracing on a Scatter Plot
Press . The trace option always starts with the stat plots and then moves
to equations in the
Y screen (if any are turned on), even if you can’t see them
in the current window. Be sure to turn off any plots and any equations you do
not want to see or trace.
TRACE
GRAPH
12nd
ENTER
CLEAR
Y
WINDOW
DA2CN_773_01.qxd 10/19/05 9:53 Page 16

 Loading...


