Discovering Algebra Calculator Notes for the Texas Instruments TI-Nspire ©2014 Kendall Hunt Publishing 2
Calculator Note: Histograms (continued) TI-Nspire
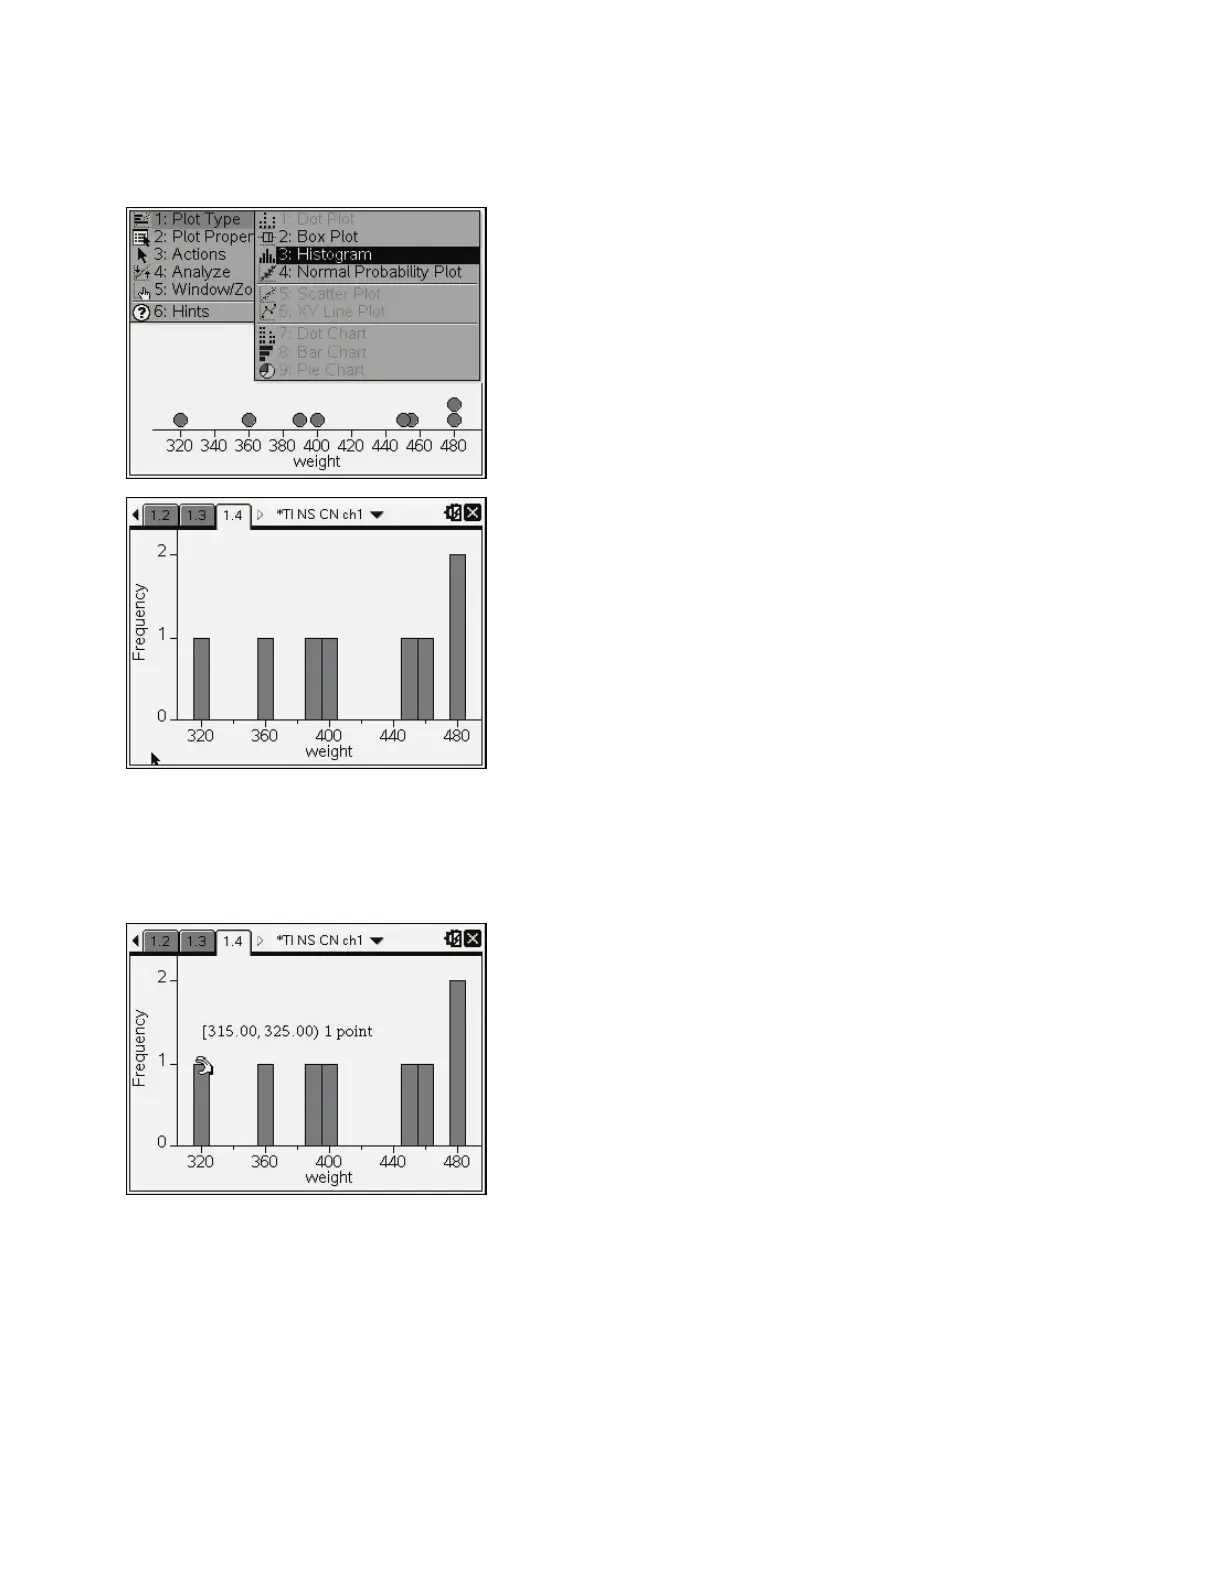
To change the Plot Type to a Box Plot, press b and choose
Plot Type> Histogram.
Tracing on a Histogram
Use the Touchpad to move the cursor over the Histogram so you can see the
values that make up the Histogram. In this screen shot, there is one data point
within the range of 315 to 325.
(continued)

 Loading...


