13
12
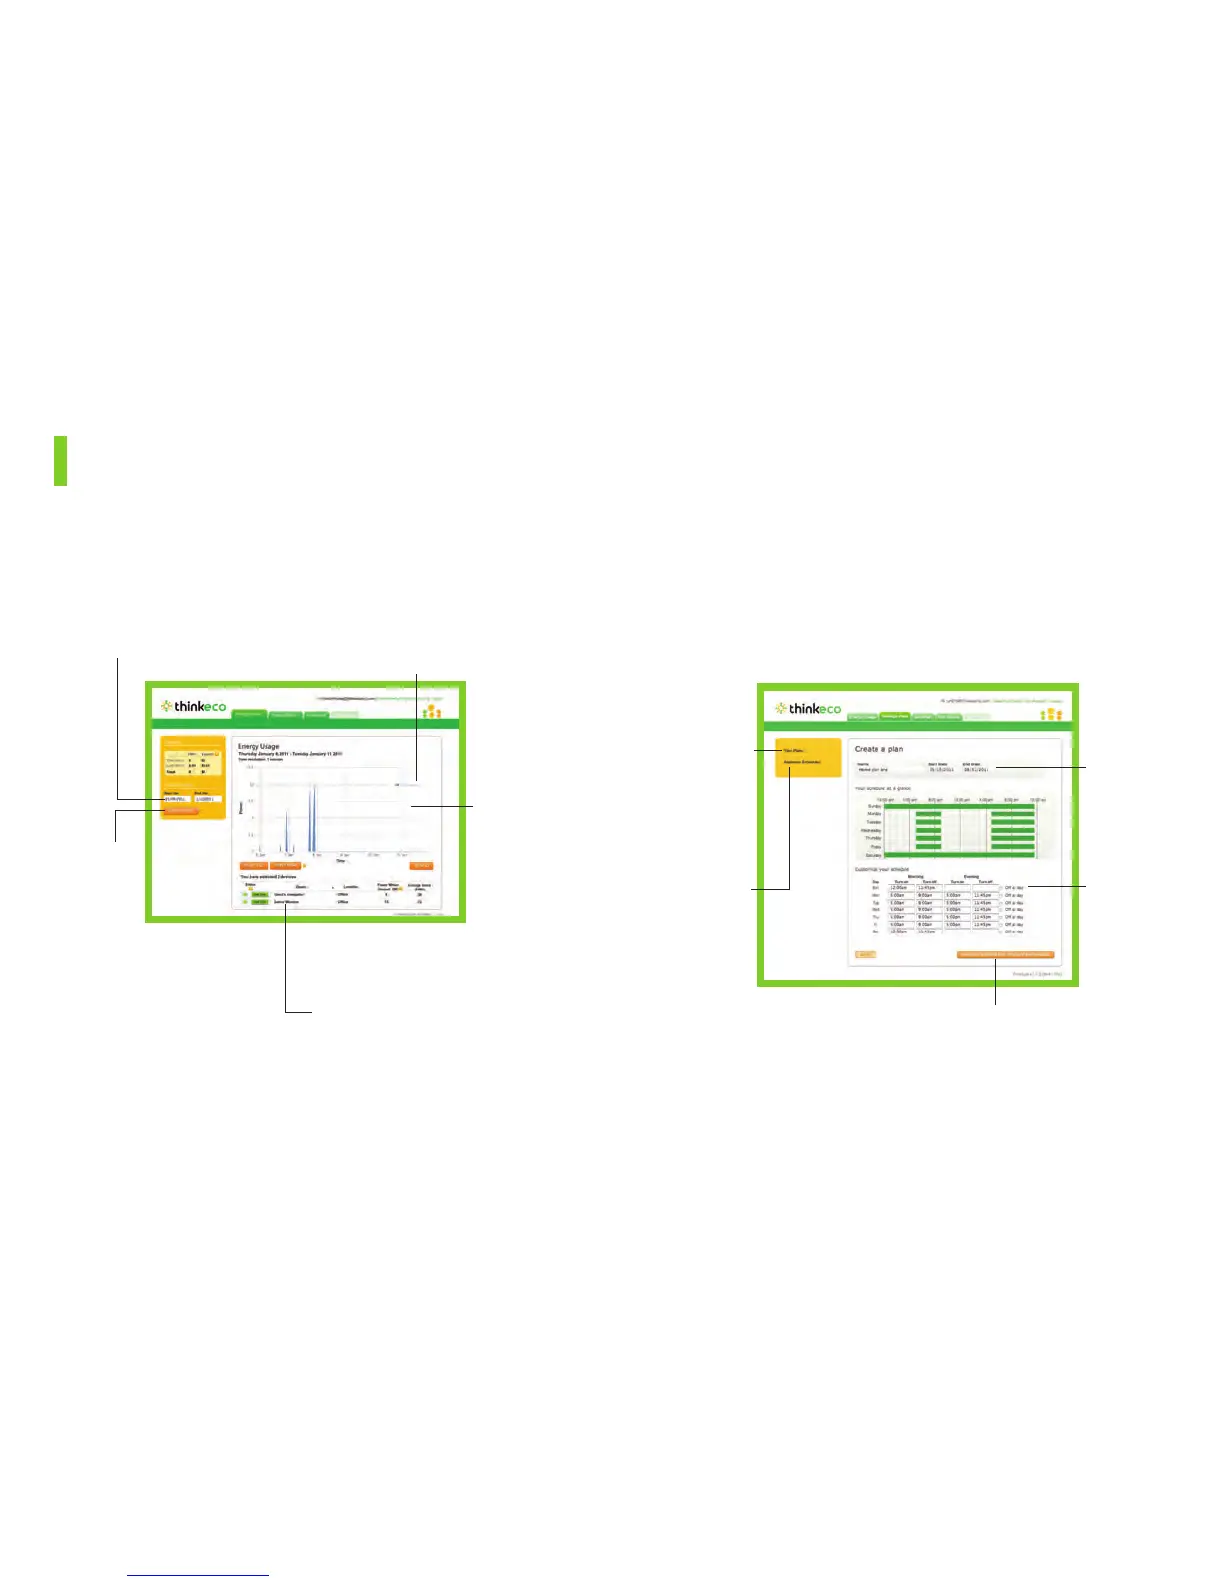
Software tips
Displays total power consumption for all A/Cs as well as individual
A/C units.
1. Energy Usage
Customize the time period
displayed on the graph.
View up to 5 individual power traces as
separate lines or the total power con-
sumption for more than 5 A/Cs.
Click and
drag your
mouse across
a section of
the graph to
zoom in.
Click on the names of one
or more A/Cs to display their
consumption on the graph.
Export current
data displayed
to a file for
more analysis.
Allows you to set schedules for when your window A/C is on or off.
When you schedule your window A/C to be “on,” the thermostat is
activated and works with the modlet to maintain the target temperature
in the room. Please note, this feature is only available after the initial
baseline period.*
2. Savings Plans
*The baseline period refers to the first few weeks after you set up your Modlet Network. The
baseline period monitors the typical energy consumption of your A/Cs. This information helps
you create plans and calculate savings.
You can create
more than one
plan – such as
one for week-
days and one
for weekends.
View an
overview of
the schedules
planned for
today.
Create a plan
for as little as
one day or for
many years.
Select days
and times for
your A/C to
turn on.
Select which A/Cs the plan
applies to. You can create a
separate plan for each outlet.