015 | EN
Figure 3.3.1
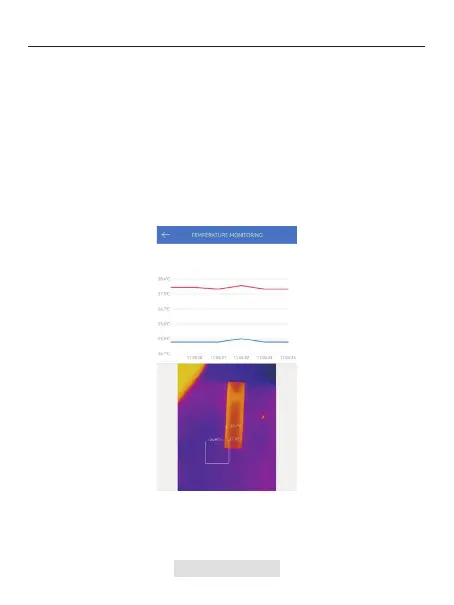
Tap "Generate Image", and select the desired monitoring type as
prompted. Then, select the place to be monitored on the screen.
Tap "Start Recording". Real-time temperature of the measured object will
be displayed in a graph.
1.
2.
In this module, real-time temperature data can be displayed in a graph,
allowing users to intuitively observe data changes.
Temperature Monitoring