Prescription maps are read into the system via three le types:
Shape le (*.shp)
Shape les indicate “zones” in the eld that will have dierent rates. These zones can
appear either as a grid or as more of a contour map. The le contains simple GPS poly-
gons, with each individual polygon mapping to a zone.
The system requires the following values for specic parameters in the shape le and
will not accept shape les without these values. Refer to an ICD for shape les for more
information: https://www.esri.com/library/whitepapers/pdfs/shapele.pdf.
o Shape le version = 1000
o Shape type = Polygon Shape Id (5)
Shape le index (.shx)
- Helps index into the shape le
- Can be used to speed up reading, currently NOT used by the SeedHawk system.
Database format (*.dbf)
The database format le species the rates used for each zone. The row in the dbf le
corresponds to the polygon id in the shape le. There can be multiple columns of data
in the dbf le that corresponds to dierent products that can be selected.
The system requires the following values for specic parameters in the dbf le and will
not accept dbf les without these values. Refer to an ICD for dbf les for more informa-
tion.
o Data Type = Numeric (‘N’)
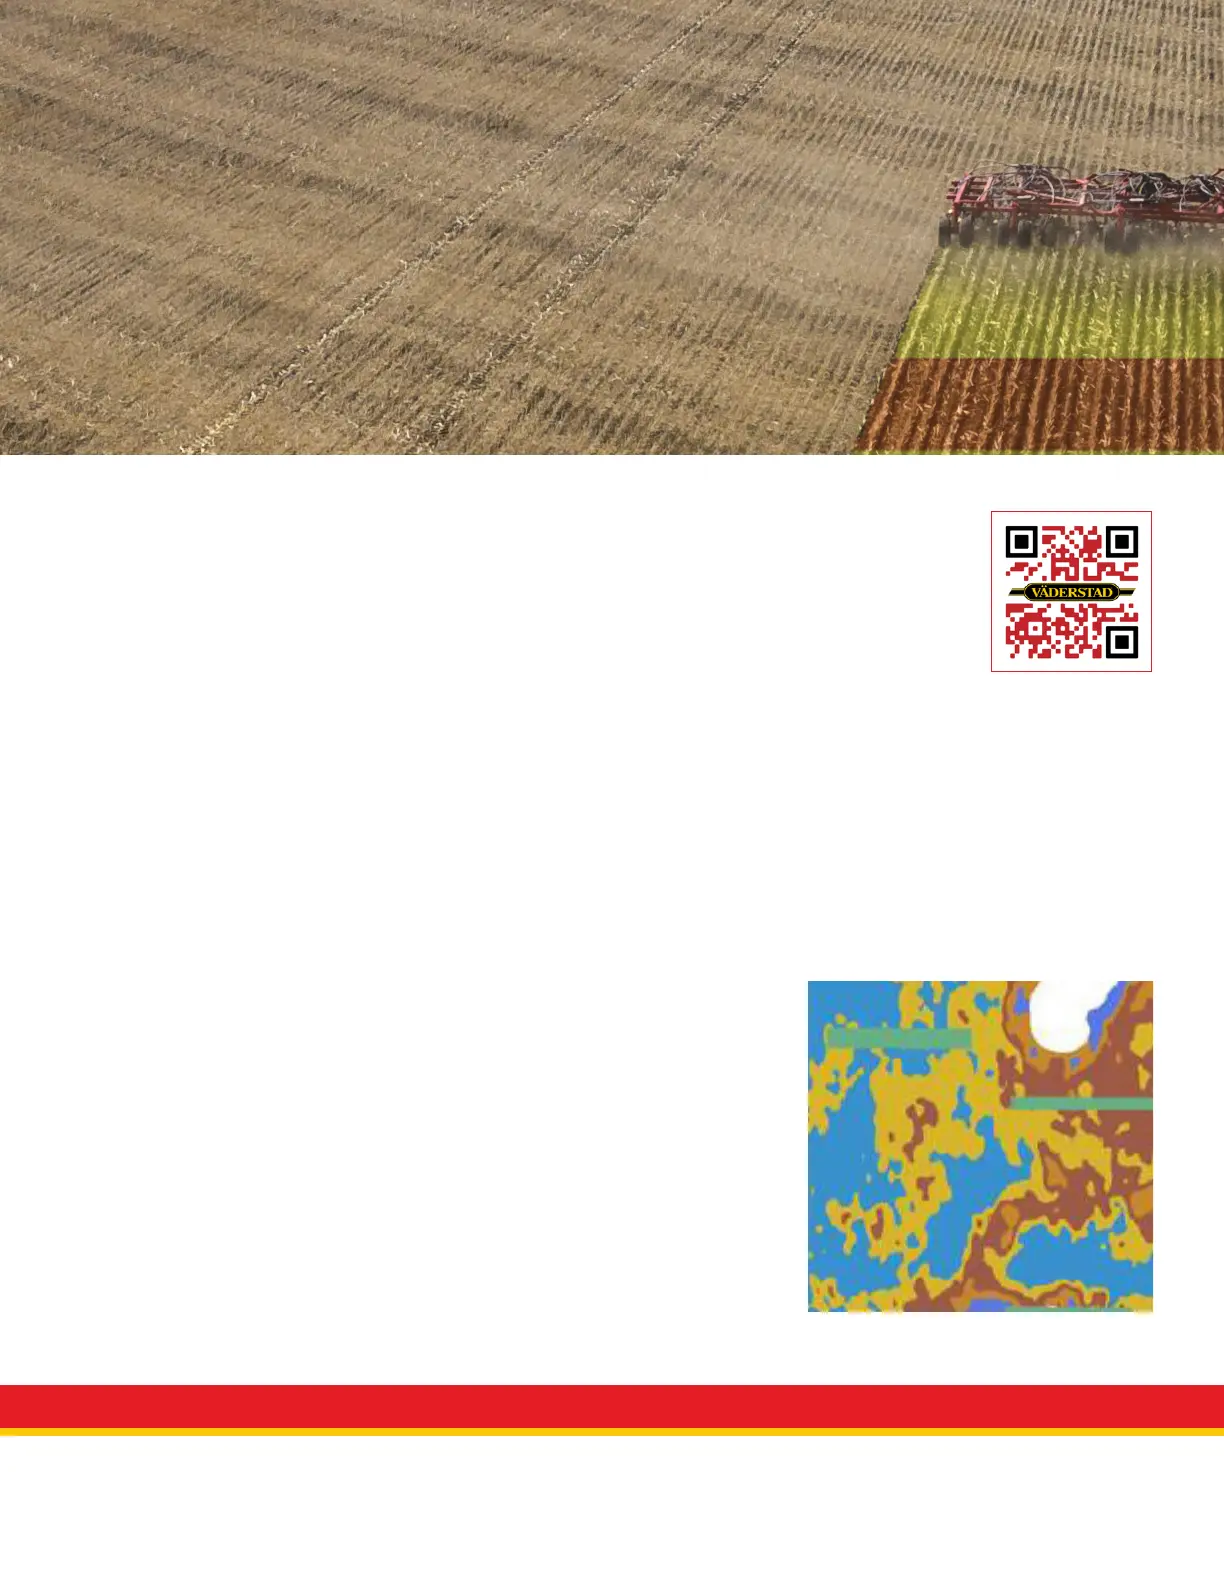
When the prescription maps are used, they are read into the system and the shape and
dbf les are combined to create a single prescription map. The image to the right is an
example of a prescription map that has been read into the system.
Prescription Mapping
A prescription map, or variable rate map, is used to automatically adjust the
target application rate of a product for a particular eld area. Prescription
maps are downloaded from a user’s cloud account and pushed to the Gateway
via the iPad. Once enabled, the target rate data is used to control application
rate and displayed to the user as a color-coded map.
Example prescription map
View QuickStart video
 Loading...