16
Contents
Previous
Page
First
Page
Next
Page
Previous
View
Balancing the camera
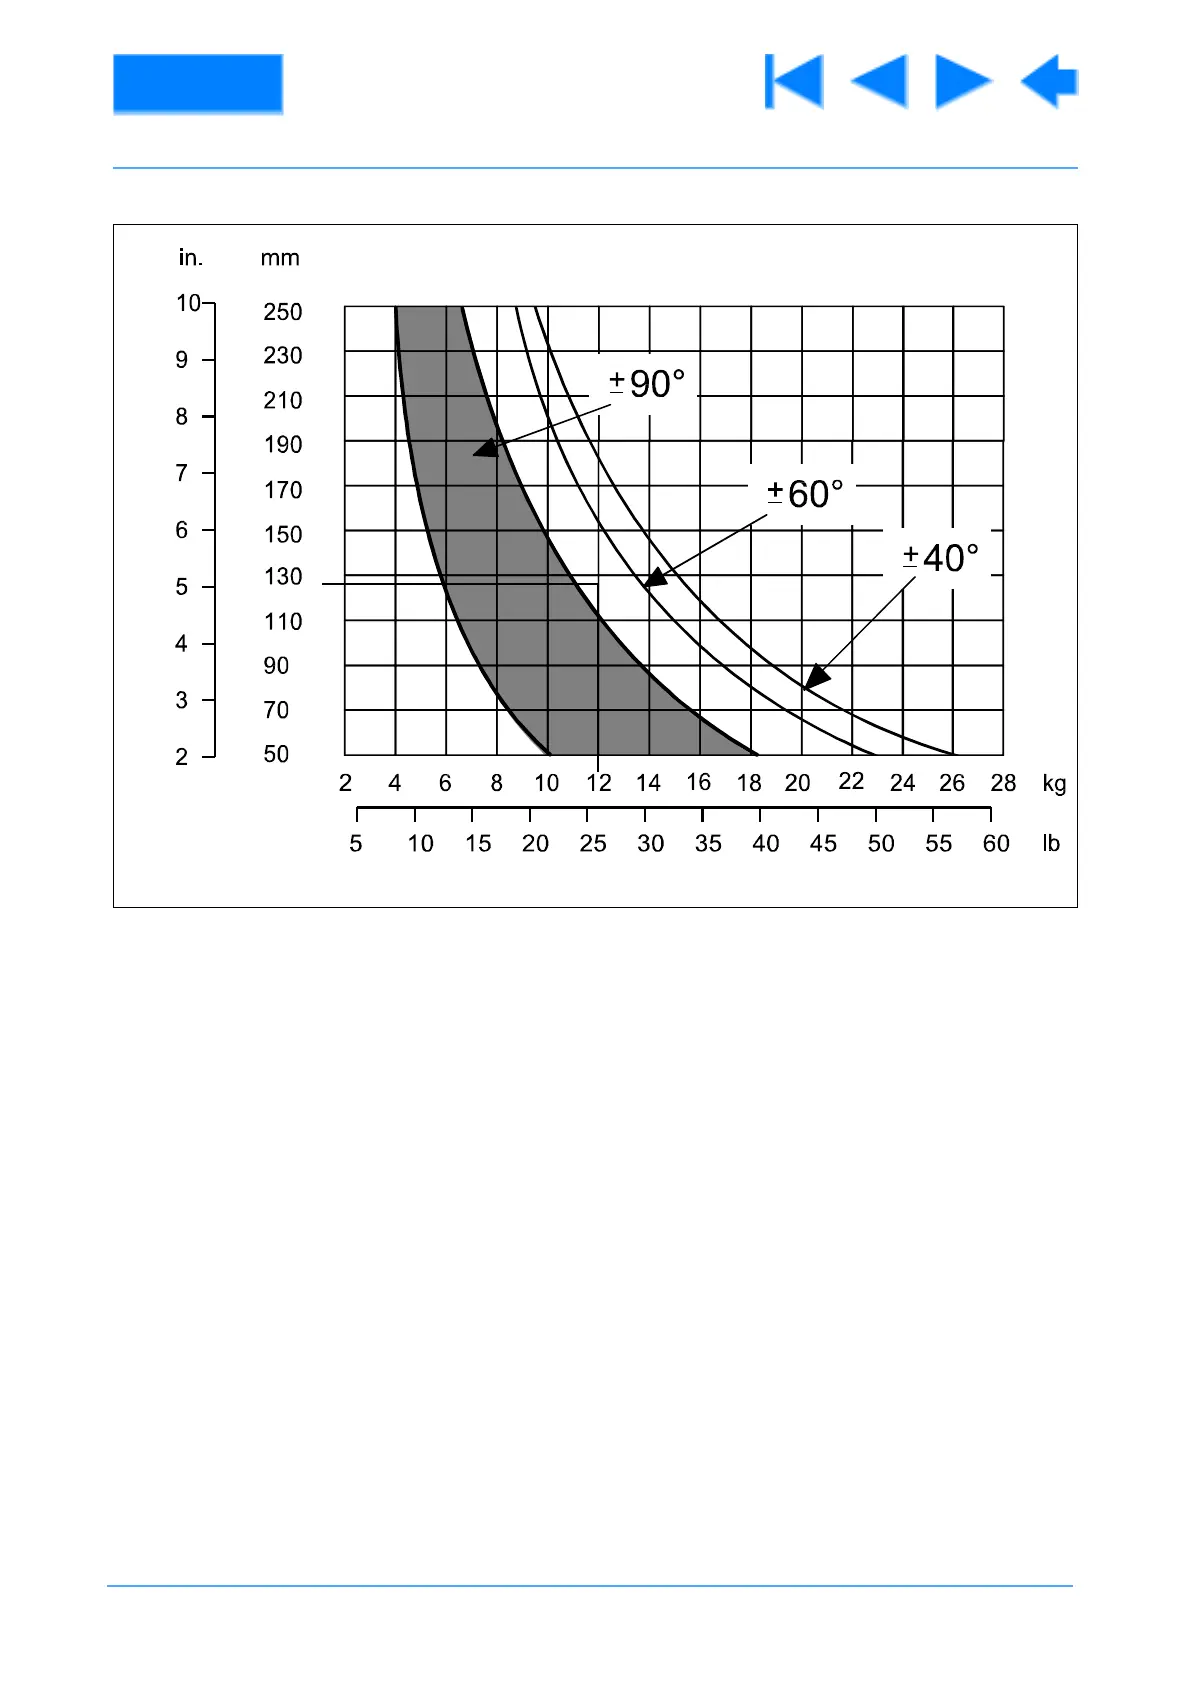
16 Fig 2.1 shows the range of load and centre of gravity (C of G) height above the mounting plate which
can be maintained in balance by the Vision SD12 head. The shaded area of the graph corresponds to those
loads/C of G heights which can be balanced over the full range of tilt (±90°). The area to the right of the ±90°
curve but under the curve ±40° indicates the progressively reducing tilt range over which the head can fully
balance higher loads. The intermediate curve (±60°) indicates the maximum load/C of G range which the
head can balance over a tilt range of ±60° and the final curve (±40°) indicates the maximum load/C of G range
which the head can balance.
17 To ascertain whether a particular load can be balanced, use Fig 2.1 as follows:
17.1 Locate the total load to be balanced on the horizontal axis of the graph, and the height of its C of
G on the vertical axis. Project lines from these points. If the intersection lies inside the ±40° curve the
load can be balanced over the tilt range indicated. If the intersection lies outside the ±40° curve the
camera will not be perfectly balanced on the Vision SD12 head
17.2 Example - A camera weighs 12 kg (26 lb) and has a C of G 125 mm (5 in.) above the mounting
plate. The lines intersect under the ±60° curve, therefore the head can balance the load over at least
±60° of tilt movement.
Fig 2.1 Balancing Graph
Centre of Gravity Height
Total Load