English
13
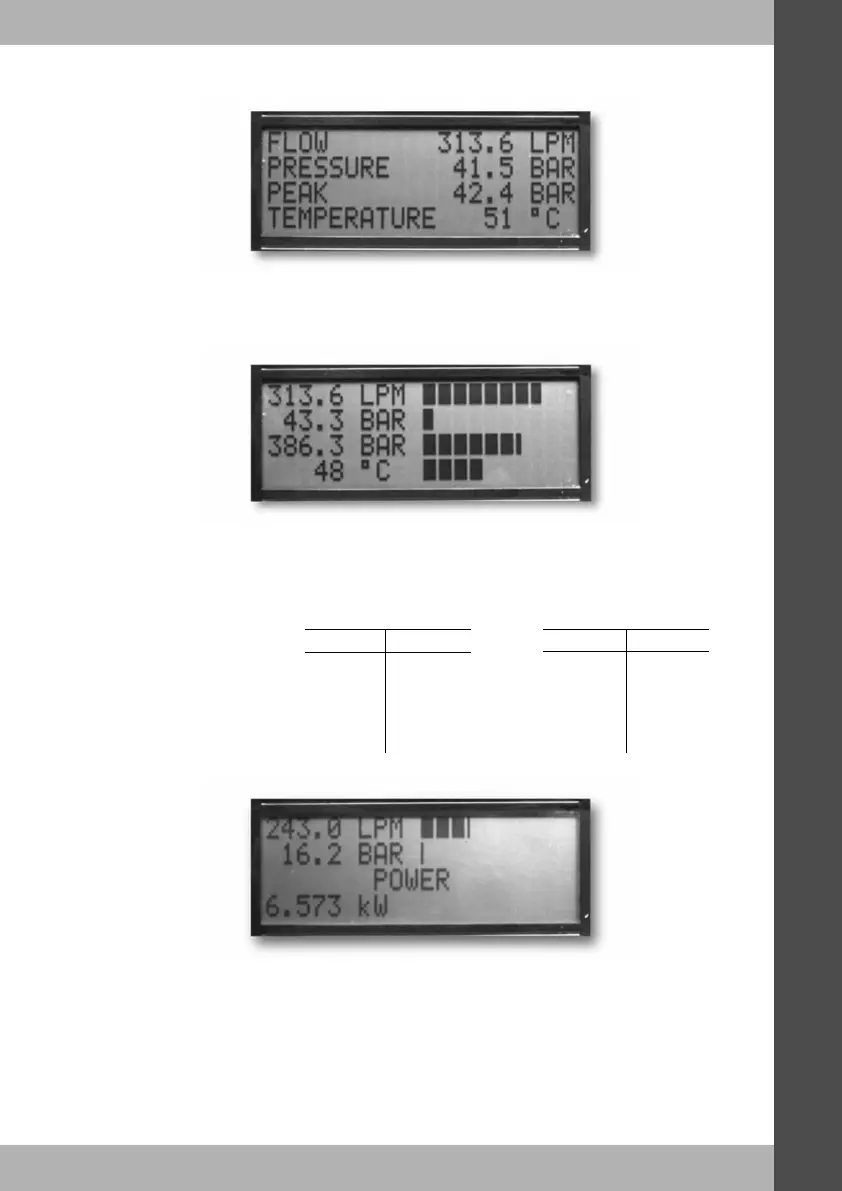
This screen displays the measurement type, value and engineering units in digital format.
This screen displays the measurements in the same order as in SCREEN 1, but this time
displays the value, engineering units and a bar graph which corresponds to the value indicated.
The bar graph is scaled from zero to the maximum calibrated value for the tester (see below).
This screen is used for testing pump efficiency. The screen initially displays flow and pressure
on the top two lines as in SCREEN 2 and power on the bottom two lines.
Once the efficiency reference point has been entered, then the third line displays the current
efficiency and the bottom line shows the reference point, the top two lines will continue to
display the current flow and pressure.
Screen 1 (Digital)
Screen 2 (Analogue)
Screen 3 (P - Q)
Bar graph scaling:
EU US
DHM403 DHM803 DHM403 DHM803
Flow LPM 0 - 400 0 - 800 GPM 0 - 100 0 - 210
Pressure BAR 0 - 600 0 - 600 PSI 0 - 8700 0 - 8700
Peak BAR 0 - 600 0 - 600 PSI 0 - 8700 0 - 8700
Temperature °C 0 - 120 0 - 120 ° F 32 - 250 32 - 250
Power kW 0 - 400 0 - 800 HP 0 - 536 0 - 1072
 Loading...