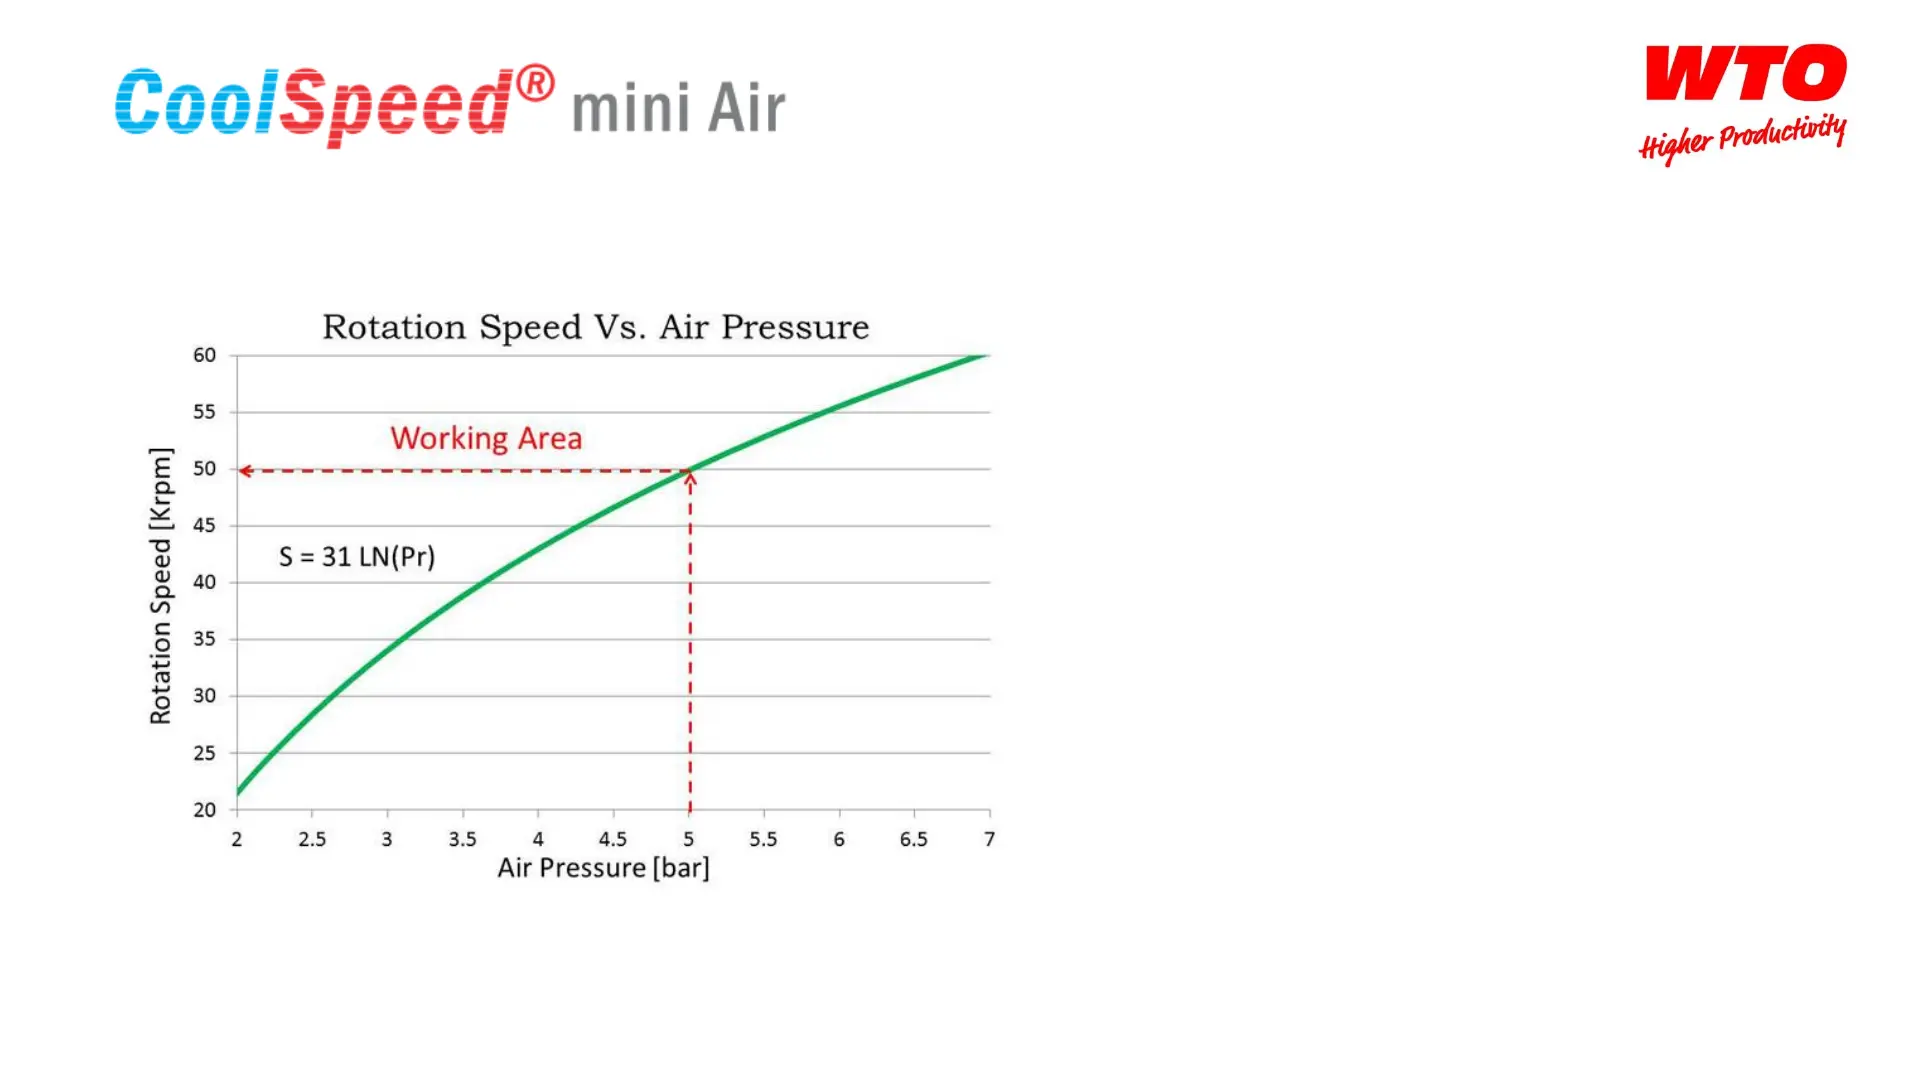
• This chart illustrates the logarithmic nature of
the rotation speeds measured at different
pressure levels.
• The formula displayed within the chart can be
used to calculate the rotation speed at any
pressure level.
• The curve is relates to average values. The
actual results lie within a small variance from
the curve.
• The rotation speed levels shown here are the
no-load speeds (i.e. no torque acting upon the
shaft).
 Loading...