Hardware and physical integration guideline PCR Sensor A111
Page 13 of 32
2022-03-08 © 2022 by Acconeer – All rights reserved
Figure 11. Placement of the radome in relation to the sensor.
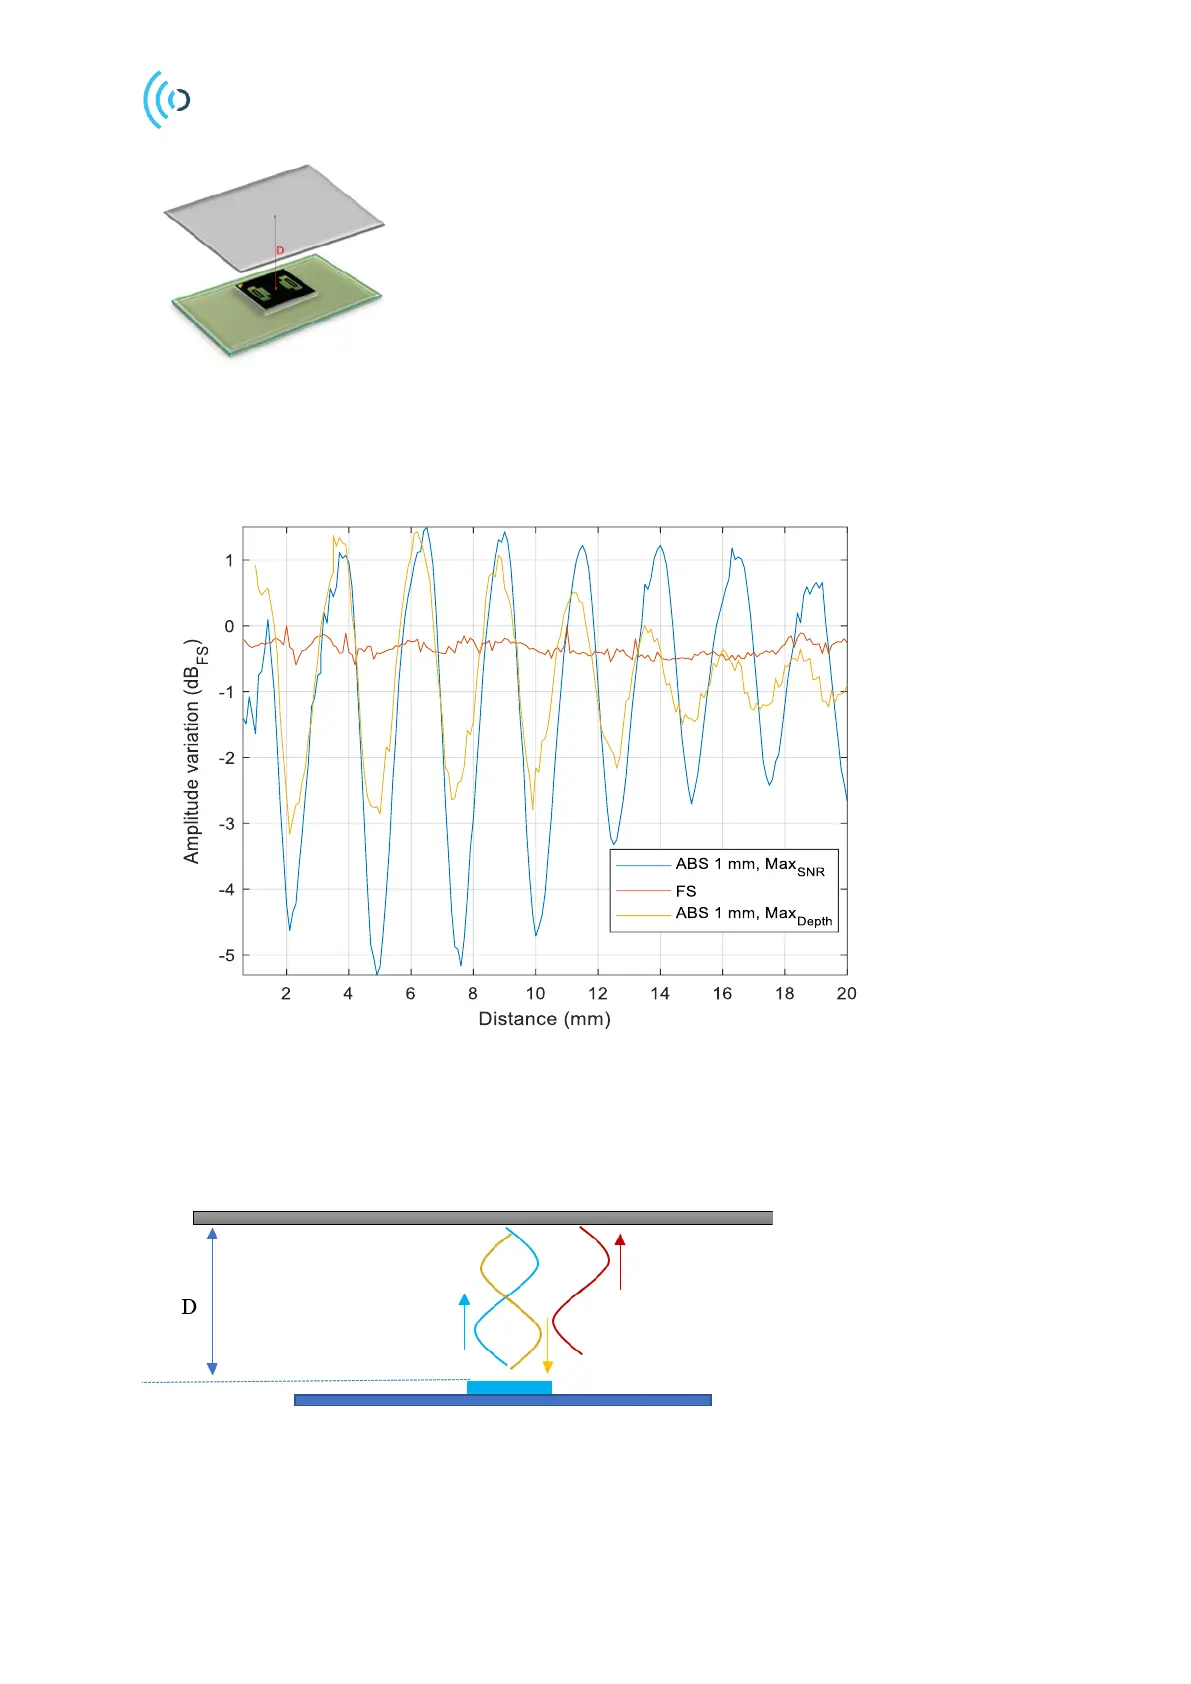
Figure 12. Measured reflected power from the target versus the radome to sensor distance for two different service
profiles, Profile 2 (MaxSNR) and Profile 1(MaxDepth). Amplitude is nomalized by the maximum value of Free Space.
Amplitude variation is stated in one direction (Tx or Rx side). For Radar Loop Gain (RLG) the values will be
doubled.
Figure 13. Illustration of the transmitted pulse and the reflected pulses (from plastic cover and the PCB).