Hardware and physical integration guideline A1 PCR sensors
Page 18 of 30
© 2024 by Acconeer – All rights reserved 2024-02-07
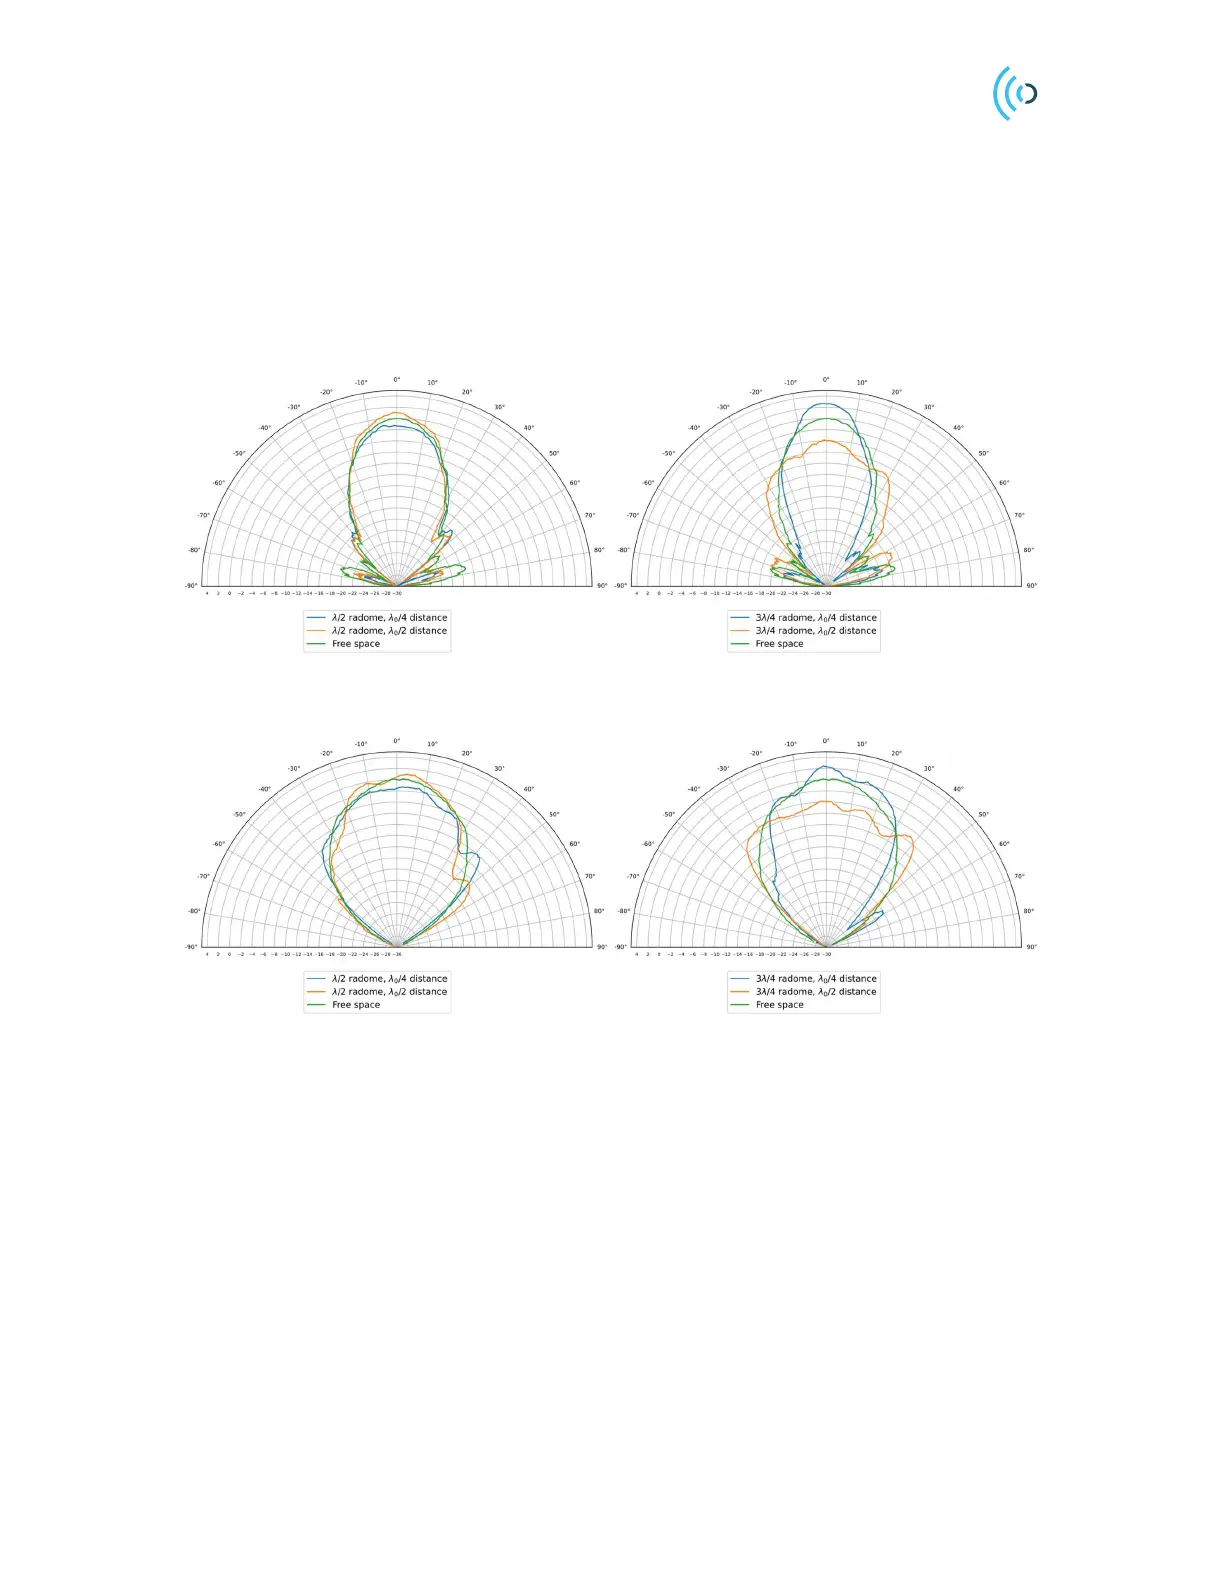
3.7.3 Impact of radome on the RLG pattern
Figure 14 and Figure 15 shows the radar RLG pattern when a radome made of ABS with a permittivity
of ε
r
= 2.6, with λ/2 (1.6 mm) and 3λ/4 (2.2 mm) thickness is placed at distances corresponding to the
harmonics of the quarter-of-a-wavelength of the radar pulse. The reference case is FS (free space i.e.
no radome). For the case of an optimal thickness, 1.6 mm, the variation because of the distance is
minimized. λ
0
is the free space wavelength at 60.5 GHz, 5 mm. λ
is the wavelength in the dielectric at
60.5 GHz, in this case, 3.1 mm. The reason for the increased gain of the 3λ/4
(2.2 mm) radome
compared to free space is because of constructive interference from the reflected wave at the sensor.
Figure 14: Impact of the radome-to-sensor distance on the RLG pattern (E-plane). The radial axis is the amplitude,
stated in two directions (Tx and Rx side), i.e. Radar Loop Gain (RLG) and normalized to free space radiation.
Figure 15: Impact of the radome-to-sensor distance on the RLG pattern (H-plane). The radial axis is the amplitude,
stated in two directions (Tx and Rx side), i.e. Radar Loop Gain (RLG) and normalized to free space radiation.
It is not recommended to place the cover directly on the sensor. Figure 16 shows the RLG pattern on the
E- and H-plane when the cover (ABS plastic sheet) is located on top of the sensor. In comparison with
free space, there is around 6 dB loss on both max. power and total radiated power for this case.
 Loading...