Owner’s Guide
22
The documentation for LabChart does not cover front-end-specific features. The GSR
Amp dialogs for LabChart for Macintosh and LabChart for Windows are very similar and
are described here together.
Note: You cannot start sampling in LabChart if a connected GSR Amp is not zeroed.
Therefore, the first step is to zero the device.
The GSR Amp dialog
The GSR Amp dialog appears when you choose GSR Amp… from a Channel Function
pop-up menu (or click GSR Amp… in the Input Settings column in the Setup > Channel
Settings... dialog).
The GSR Amp dialog allows so ware control of the combined options from the circuitry
of the PowerLab and GSR Amp. The signal present at a channel’s input is displayed so
you can see the e ects of changing the settings. The GSR Amp is pre-calibrated and
measures skin conductivity directly in µS (microsiemens). Once the GSR Amp is zeroed
and settings have been changed, click OK to apply them.
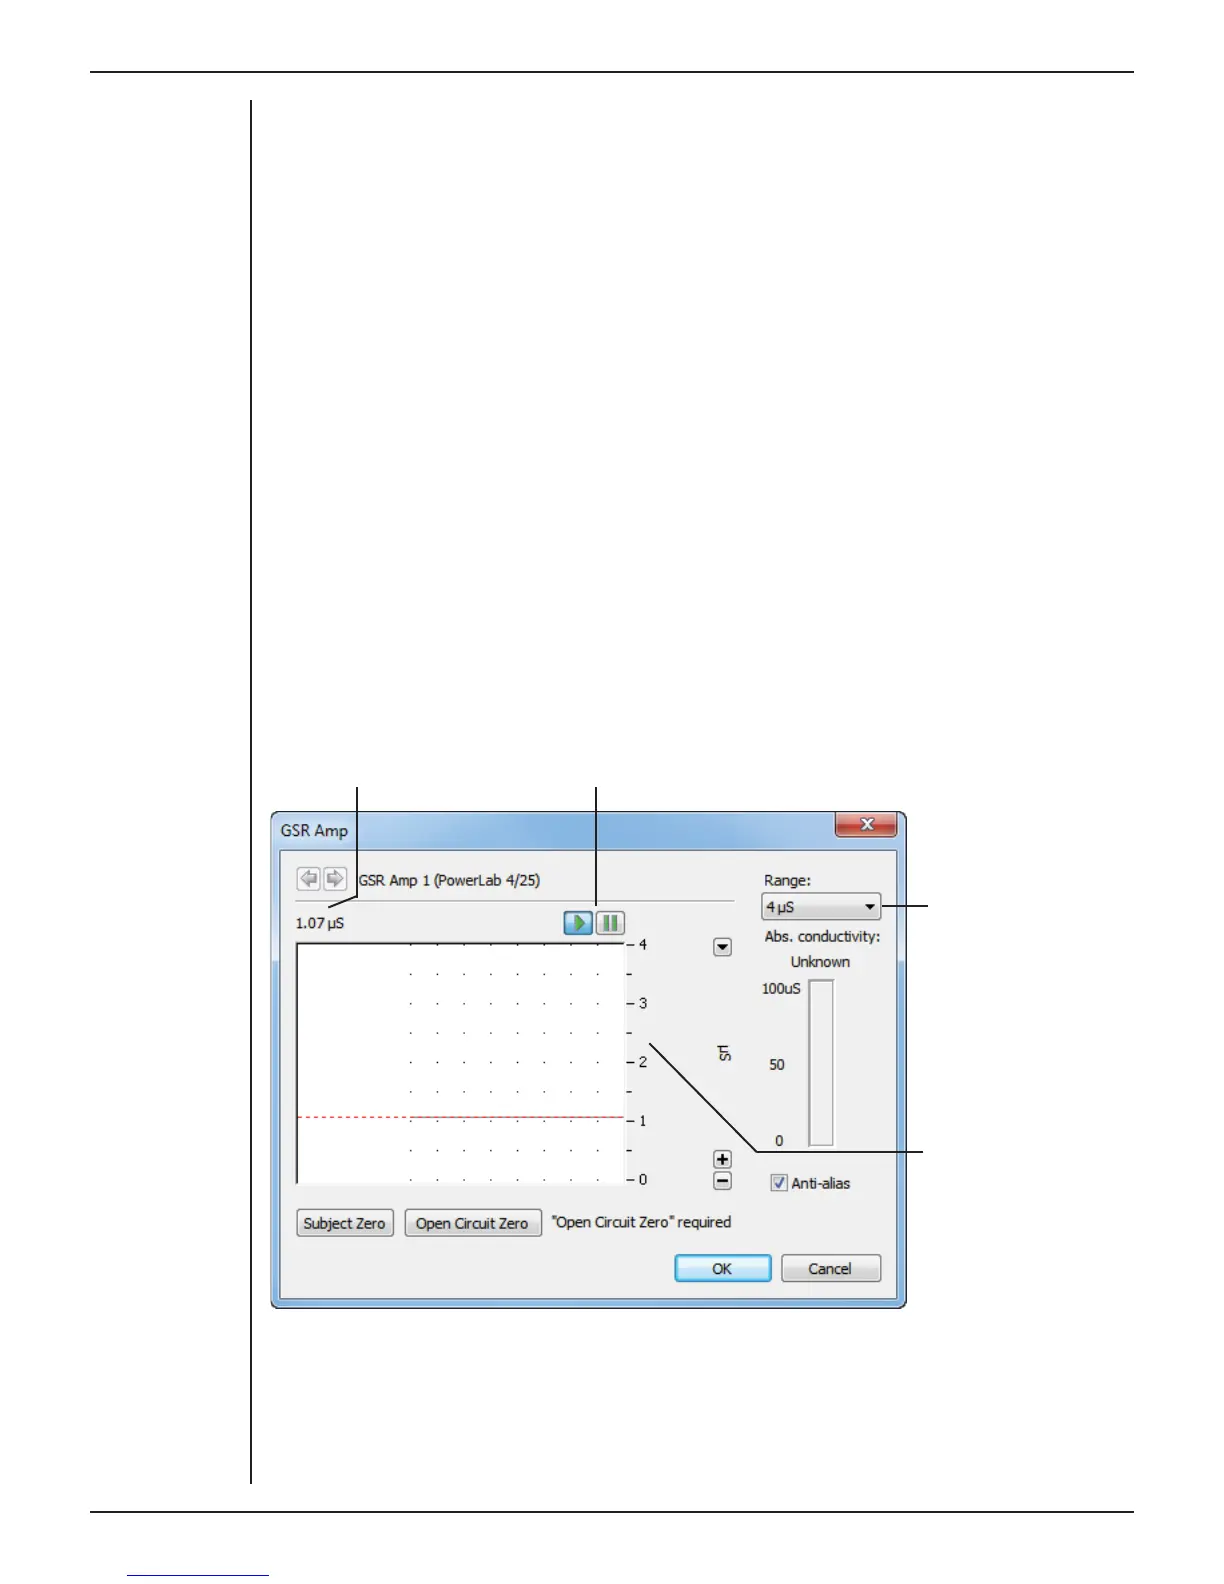
Signal Display
The input signal is displayed so you can see the e ect of changing the settings — no data
are recorded while you adjust the settings. The average signal value is shown above the
display area.
Signal amplitude Pause and Scroll buttons
Range
pop-up
menu
Amplitude
axis
You can stop the signal scrolling by clicking the Pause button at the bottom le
(Macintosh) or top right (Windows) of the data display area. This changes to the Scroll
button on the Macintosh. Click the Scroll button to start scrolling again. You can shi
and stretch the vertical Amplitude axis to make the best use of the available display
Figure 3–4
The GSR Amp
dialog for
Windows (before
an Open Circuit
Zero)