Chapter 3 41
Making a Basic Measurement
Viewing a Signal
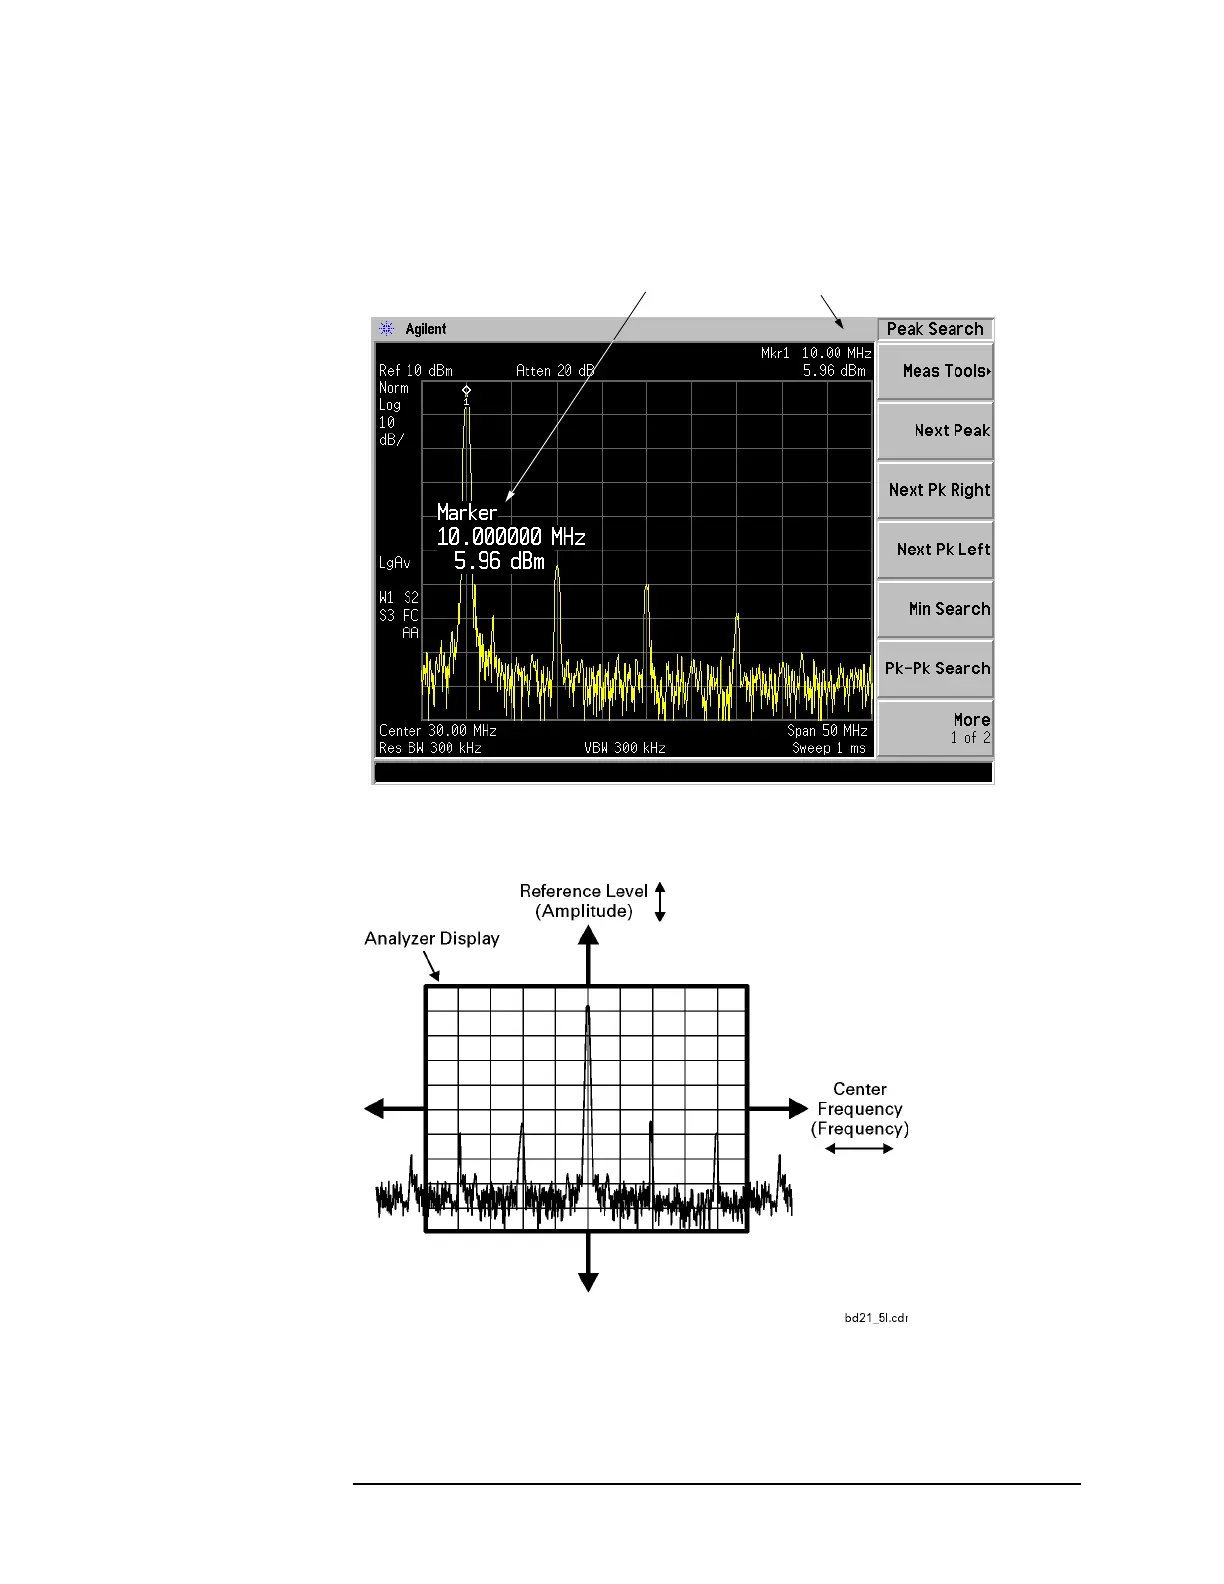
the display. Increasing the span increases the frequency range that appears
horizontally across the display.
Figure 3-3 A Marker on the 10 MHz Peak
Figure 3-4 Relationship Between Frequency and Amplitude
Improving Frequency Accuracy
10.While not all of the zeros following the decimal in the active function block are
 Loading...