Manual V1.00_2009_V5
8.5 Thermal flying Mode
8.5.1 Wind distribution curve
The wind distribution curve only becomes visible in the display once the pilot has flown at
least a full circle, or a figure-eight. The instrument uses the SOG to calculate wind speed
and –direction.
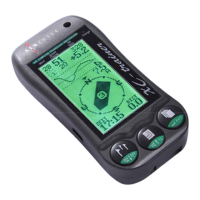
8.5.1 Basic Wind distribution curve
A thin vertical bar shows the compass direction still
needed to calculate the wind direction. Fly in this
direction to acquire the data needed.
This line show
s a compass that has been ‘opened up’. North is in the middle.
'S--W--N--E--S'.
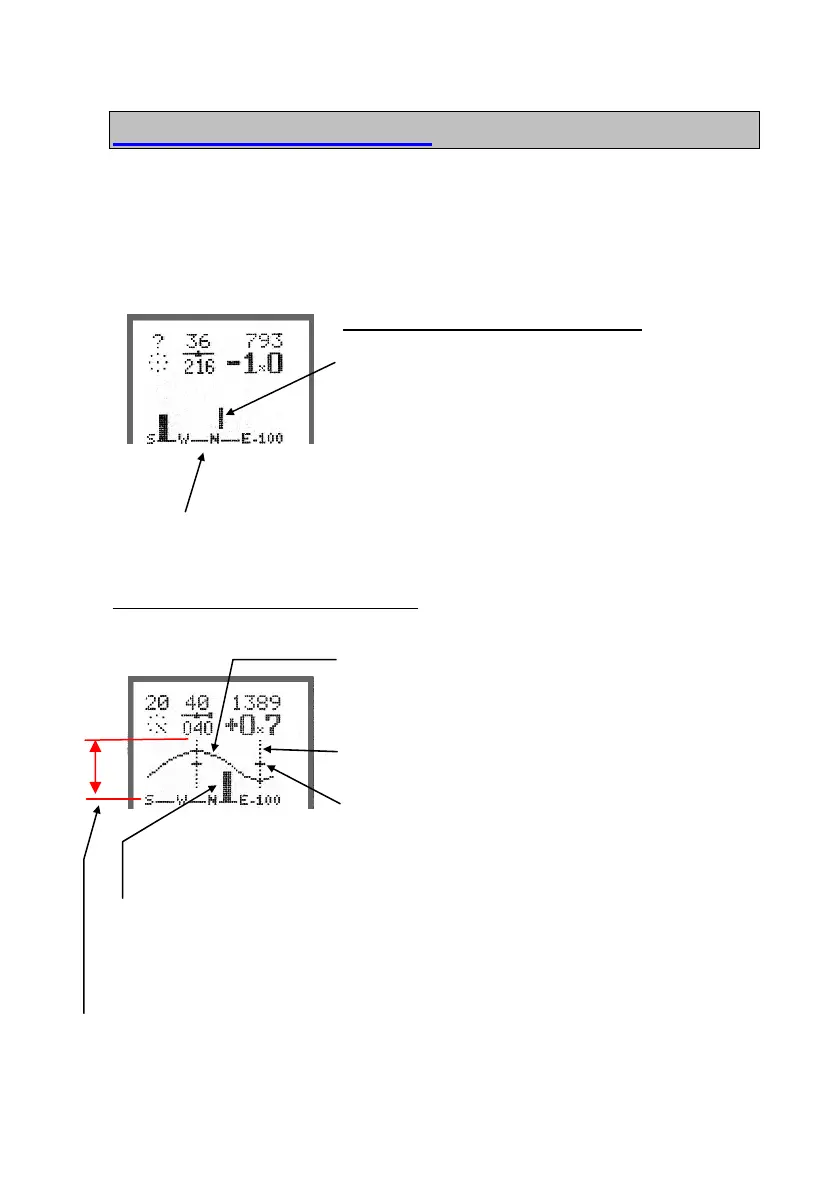
8.6.2 Active Wind distribution curve
The wind curve is really a speed distribution curve. It
gives the average ground speed to be expected when
gliding in any direction.
Two thin lines intersecting the curve indicate Upwind /
Downwind.
The little lines crossing the thin lines indicate the mean
True Air Speed (TAS), in this image app. 55km/h
SOG-bar:
The bar height is used to indicate the current Speed Over Ground (SOG), and the bar sits
on the compass rose at the position of the current heading (COG – Course Over Ground)
Scale:
The full height of the coordinate system corresponds to 100km/h. Where the curve touches
the bottom line the SOG is 0km/h, where it touches the top it is 100km/h SOG.
In this example, flying NW will give a SOG of app. 75km/h (tailwind) whereas flying SO
(headwind) will give 25km/H
Page 22
 Loading...