UM_AlsSUMPC(50_100_140)_EN_1.0_11-17.docx 10 / 14
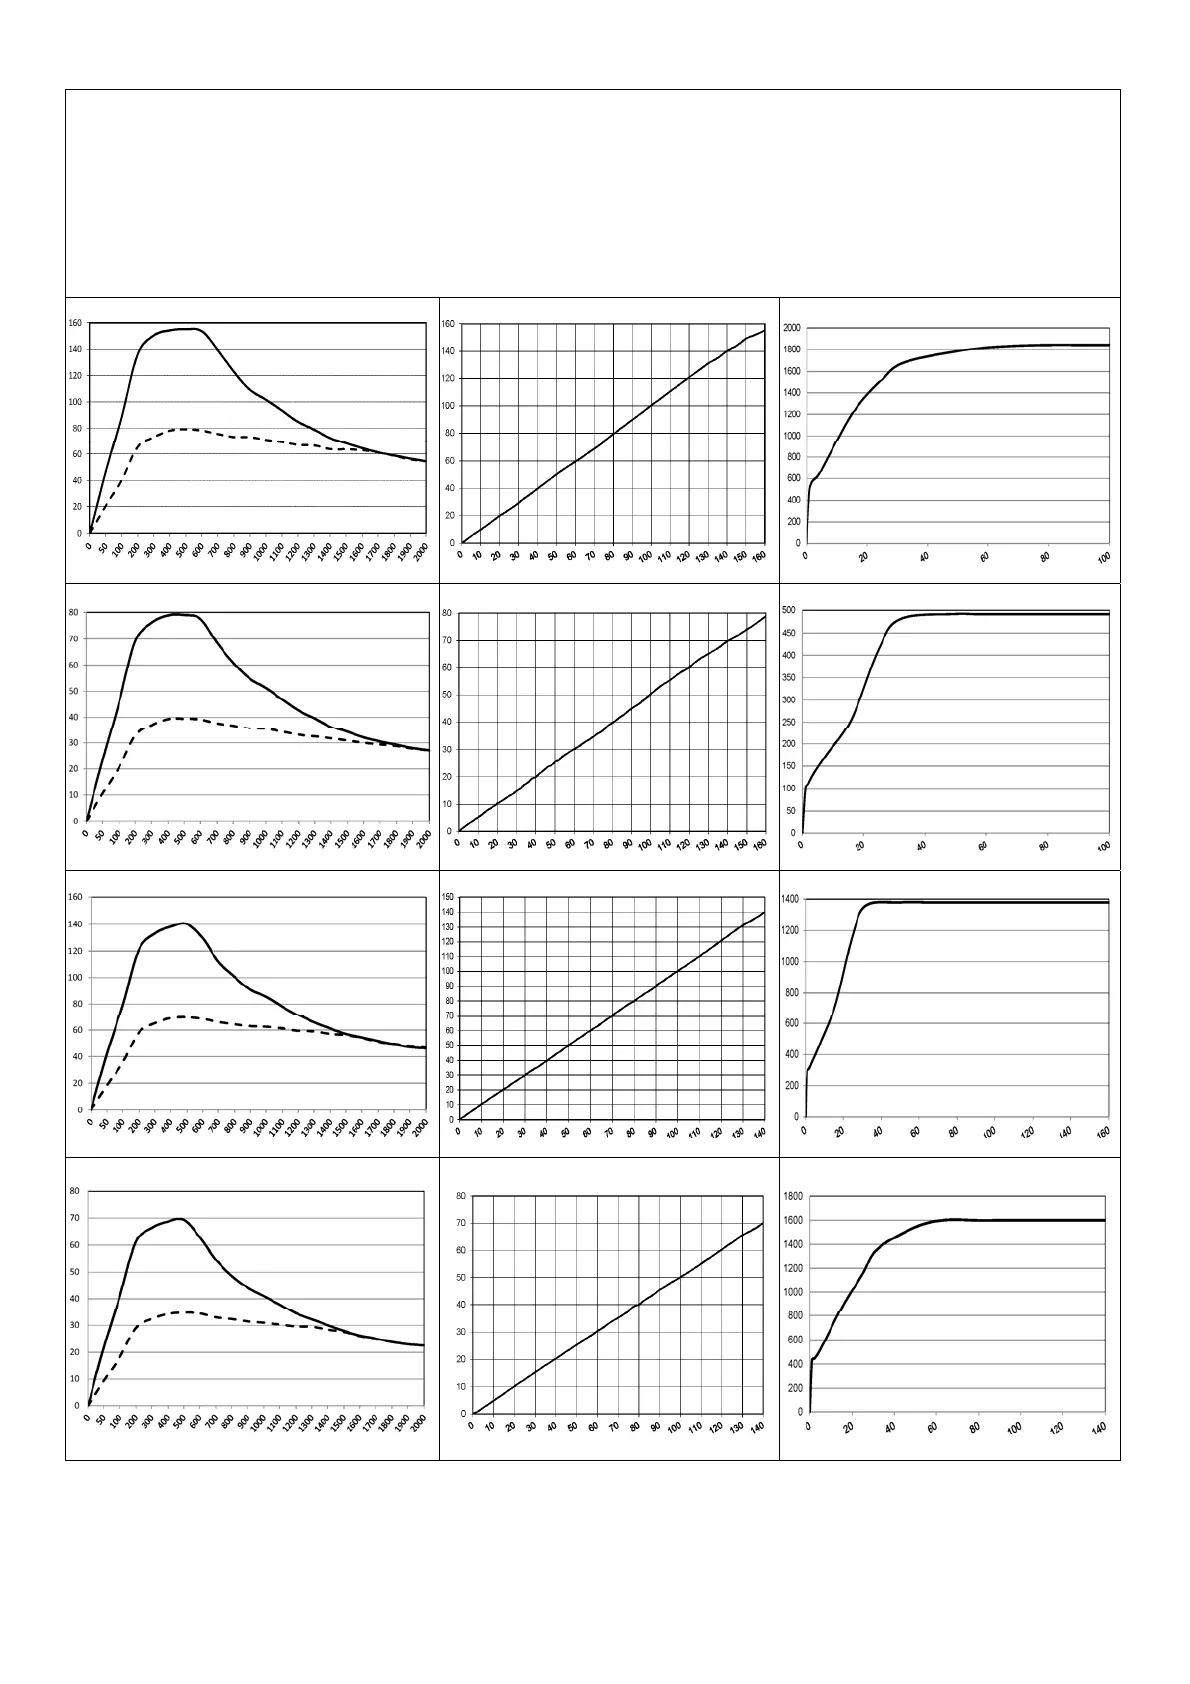
Currents diagrams (tolerance ± 20%)- They include following diagrams:
1- The change of the monopolar output power (with loads from 50 to 2000 Ω) by setting the 100% and the 50% of the maximum power
Maximum power W (power)
▲ / (loads) ►
The change of the bipolar output power (with loads from 10 to 1000 Ω) by setting the 100% and the 50% of the maximum power
Maximum power W (power)
▲ / (loads) ►
2- The increase of the output power (with the rated load) versus the power setting increase W ▲ / Setting ►
3- The change of the peak to peak voltage versus the power setting increase Vpp
▲ / Setting ►
The measurement is performed in accordance with IEC 60601-2-2 (Values detected within a 1 second by excluding lower transients).
CUT- Pure 1 2 3
▲► ▲► ▲►
CUT- P
PULSED
1 2 3
▲► ▲► ▲►
CUT- Blend 1 2 3
▲► ▲► ▲►
CUT- B
PULSED
1 (fast)
1 2 3
▲ ►
▲ ►
▲ ►