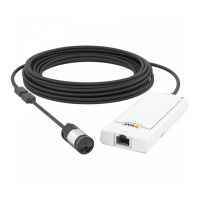
AXISP1265MkIIModularPinholeCamera
Thewebinterface
-Annotationsymbol:Selectasymbolthatappearsinsteadoftheoverlaywhenthecameraisnotwithinthe
setzoomlevels.
•Streamingindicator
:Selecttoshowananimationsuperimposedoverthevideostream.Theanimation
indicatesthatthevideostreamislive,evenifthescenedoesn’tcontainanymotion.
-Appearance:Selecttheanimationcolorandbackgroundcolor,forexample,redanimationonatransparent
background(default).
-Size:Selectthedesiredfontsize.
-
:Selectthepositionoftheoverlayintheimage.
•Widget:Linegraph
:Showagraphchartthatdisplayshowameasuredvaluechangesovertime.
-Title:Enteratitleforthewidget.
-Overlaymodier:Selectanoverlaymodierasdatasource.IfyouhavecreatedMQTToverlays,theywillbe
locatedattheendofthelist.
-
:Selectthepositionoftheoverlayintheimage.
-Size:Selectthesizeoftheoverlay.
-Visibleonallchannels:Turnofftoshowonlyonyourcurrentlyselectedchannel.Turnontoshowonall
activechannels.
-Updateinterval:Choosethetimebetweendataupdates.
-Transparency:Setthetransparencyoftheentireoverlay.
-Backgroundtransparency:Setthetransparencyonlyofthebackgroundoftheoverlay.
-Points:Turnontoaddapointtothegraphlinewhendataisupdated.
-Xaxis
-Label:Enterthetextlabelforthexaxis.
-Timewindow:Enterhowlongtimethedataisvisualized.
-Timeunit:Enteratimeunitforthexaxis.
-Yaxis
-Label:Enterthetextlabelfortheyaxis.
-Dynamicscale:Turnonforthescaletoautomaticallyadapttothedatavalues.Turnofftomanuallyenter
valuesforaxedscale.
-MinalarmthresholdandMaxalarmthreshold:Thesevalueswilladdhorizontalreferencelinestothegraph,
makingiteasiertoseewhenthedatavaluebecomestoohighortoolow.
•Widget:Meter
:Showabarchartthatdisplaysthemostrecentlymeasureddatavalue.
-Title:Enteratitleforthewidget.
-Overlaymodier:Selectanoverlaymodierasdatasource.IfyouhavecreatedMQTToverlays,theywillbe
locatedattheendofthelist.
-
:Selectthepositionoftheoverlayintheimage.
-Size:Selectthesizeoftheoverlay.
-Visibleonallchannels:Turnofftoshowonlyonyourcurrentlyselectedchannel.Turnontoshowonall
activechannels.
-Updateinterval:Choosethetimebetweendataupdates.
-Transparency:Setthetransparencyoftheentireoverlay.
-Backgroundtransparency:Setthetransparencyonlyofthebackgroundoftheoverlay.
-Points:Turnontoaddapointtothegraphlinewhendataisupdated.
-Yaxis
-Label:Enterthetextlabelfortheyaxis.
-Dynamicscale:Turnonforthescaletoautomaticallyadapttothedatavalues.Turnofftomanuallyenter
valuesforaxedscale.
-MinalarmthresholdandMaxalarmthreshold:Thesevalueswilladdhorizontalreferencelinestothebar
chart,makingiteasiertoseewhenthedatavaluebecomestoohighortoolow.
23




 To Next Page