Presettings
Operating instructions GLP
3 -- 82
6.562.98.5.01.18
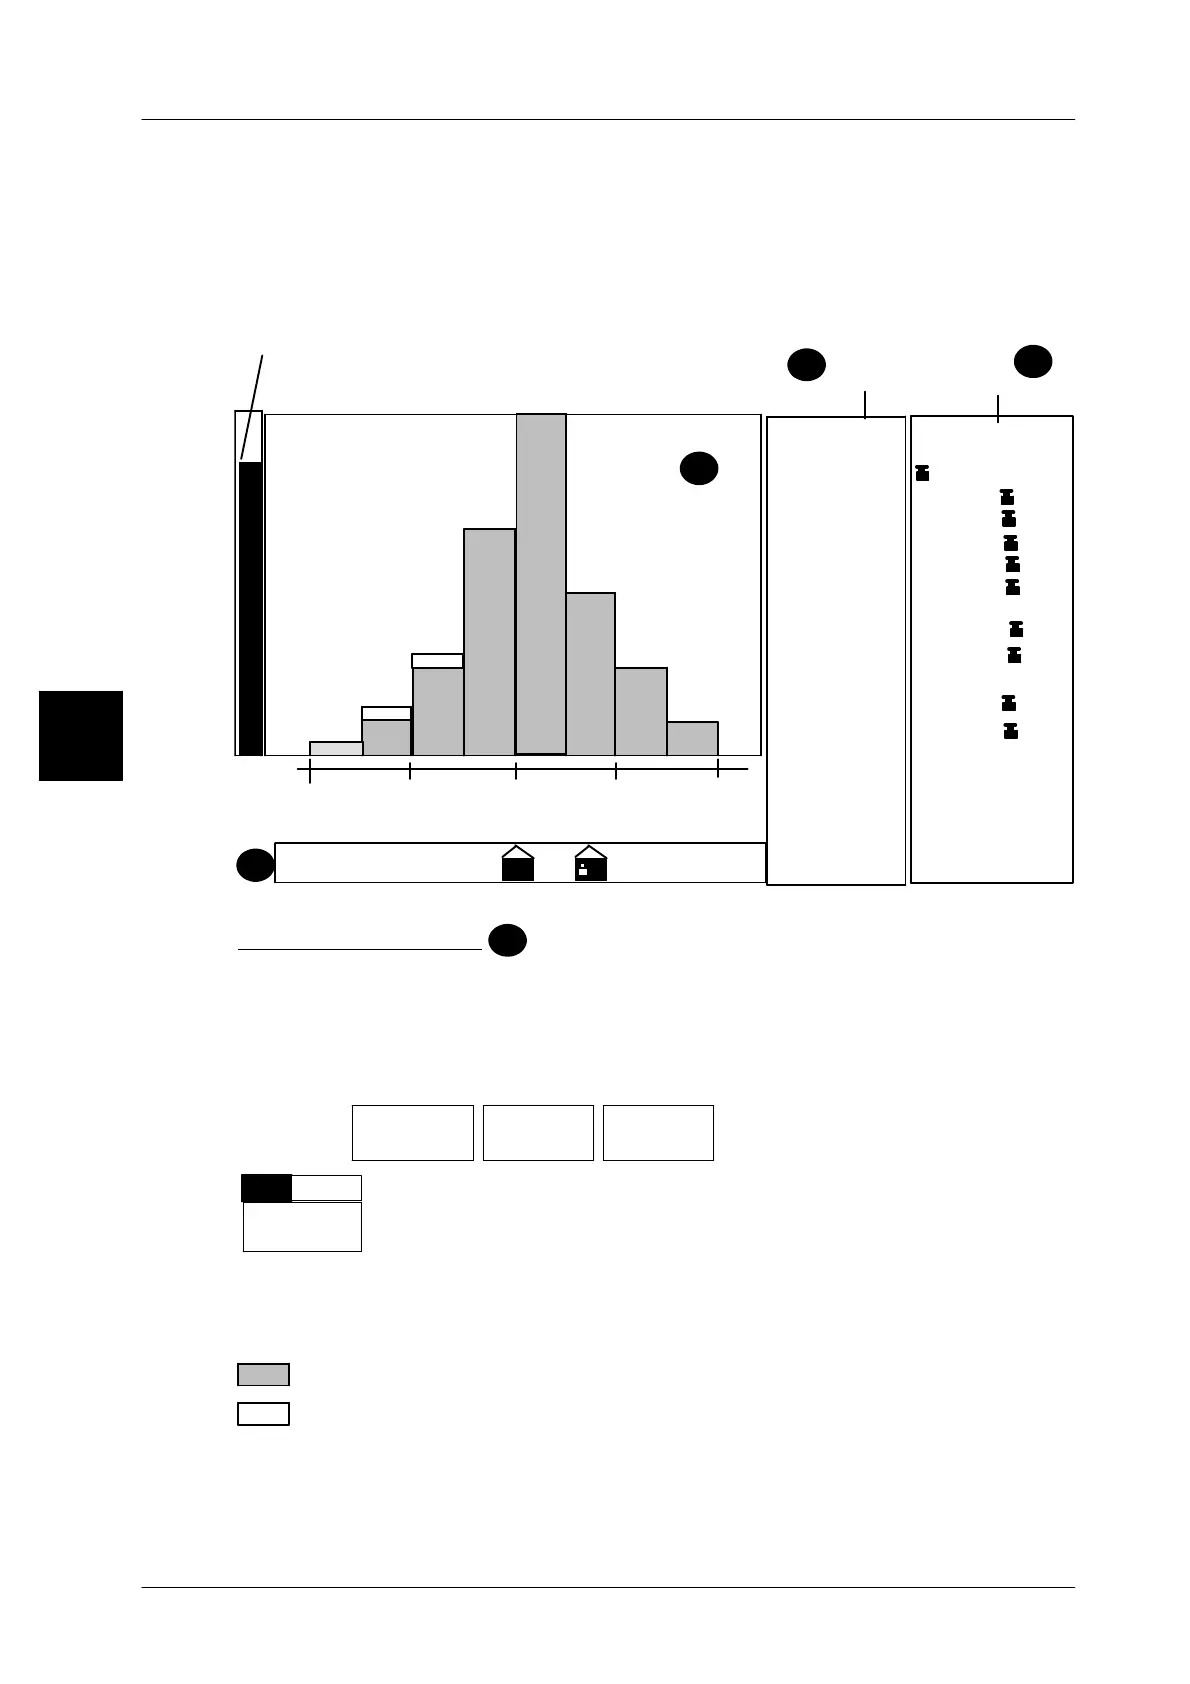
3.5.4.5 Statistics display
With statistics activated, the result of the statistical evaluation can be shown in the
GT -- CT display. Depending on the presets, the representations detailed in the
illustration are available. The display is always updated after 3 packs are weig-
hed. An entry cancels the statistics display and it is activated again after a pack
is weighed.
Histogram
display
0,200kg
0,191kg0,182kg
0,218kg
0,209kg
92%
214: 0,210 kg
213: 0,212 kg
212: 0,218 kg
211: 0,216 kg
210: 0,20ß kg
209: 0,201 kg
208: 0,214 kg
207: 0,194 kg
206: 0,198 kg
205: 0,201 kg
204: 0,198 kg
203: 0,210 kg
202: 0,212 kg
201: 0,202 kg
200: 0,208 kg
0,191--0,210kg
0,200kg Qn
0,201kg ∅
213 #
[2]Main statistics
as per FPV
205 #_ok
0,200kg ∅_ok
0,010kg S_ok
92 %_ok
1,2 % ok TU1/2
1
A
D
∅
∅∅
∅
B
TU2 TU1 QN
TO 1 TO 2
1,00 cp
1,00 cpk
0,191kg TU1
0,182kg TU2
0,236kg TO
0,182kg TU
0,011kg S
Display of
package weights
(maximum display = 100 %)
Display of
statistics data
Analog display
Histogram display
A
If the statistics report is to be indicated as a histogram in the large display and ope-
rating unit, this may be activated here. Every time 3 packages are weighed, the
histogram display will be updated.
Operating sequence: Description
------------------------------------------------------------------------------------------------------------------------------------------------------
[MODE] 2
Labe--
ling
Weight cl.
statist.
Statist.
display
-- Call up the selection menu.
Statist.
histogr.
+
--
Set the device to ’With(+)’ if the result of a statistical evaluation is
to be indicated in the form of a histogram.
Standard setting: without(--)
A chart in the histogram display indicates the tolerance ranges TU and TO calcula-
ted to FPV in relation to the nominal weight QN. The complete tolerance ranges are
halved and represented by 2 bars.
number of accepted packages in the relevant weight range
number of checked packages in the relevant weight range
The appearance of a white bar indicates that not all packages have been accepted.
3
 Loading...