Presettings
Operating instructions GLP
3 -- 83
6.562.98.5.01.18
Package weight numerical display
B
The weight of the last 15 packages weighed can be shown continuously in the
GT -- CT display (last weight at top). For this, the interface must be configured so
that the labeler sends the weight information to itself via PSV--DATA. If the single
numerator is activated and if its value is also sent via PSV--DATA, the serial number
of the single numerator is displayed in front of the weight.
Numerical display of statistical data
C
If the statistical evaluation is to be shown in numerical form in the GT -- CT display,
this can be activated here. The numerical display is always updated after 3 packa-
ges are weighed.
Operating sequence: Description
------------------------------------------------------------------------------------------------------------------------------------------------------
[MODE] 2
Labe--
ling
Weight cl.
statist.
Statist.
display
-- Call up the selection menu.
Statist.
num. data
+
--
Set the unit to ’With(+)’ if the statistics data is to be displayed in a
numeric form.
Standard setting: without(--)
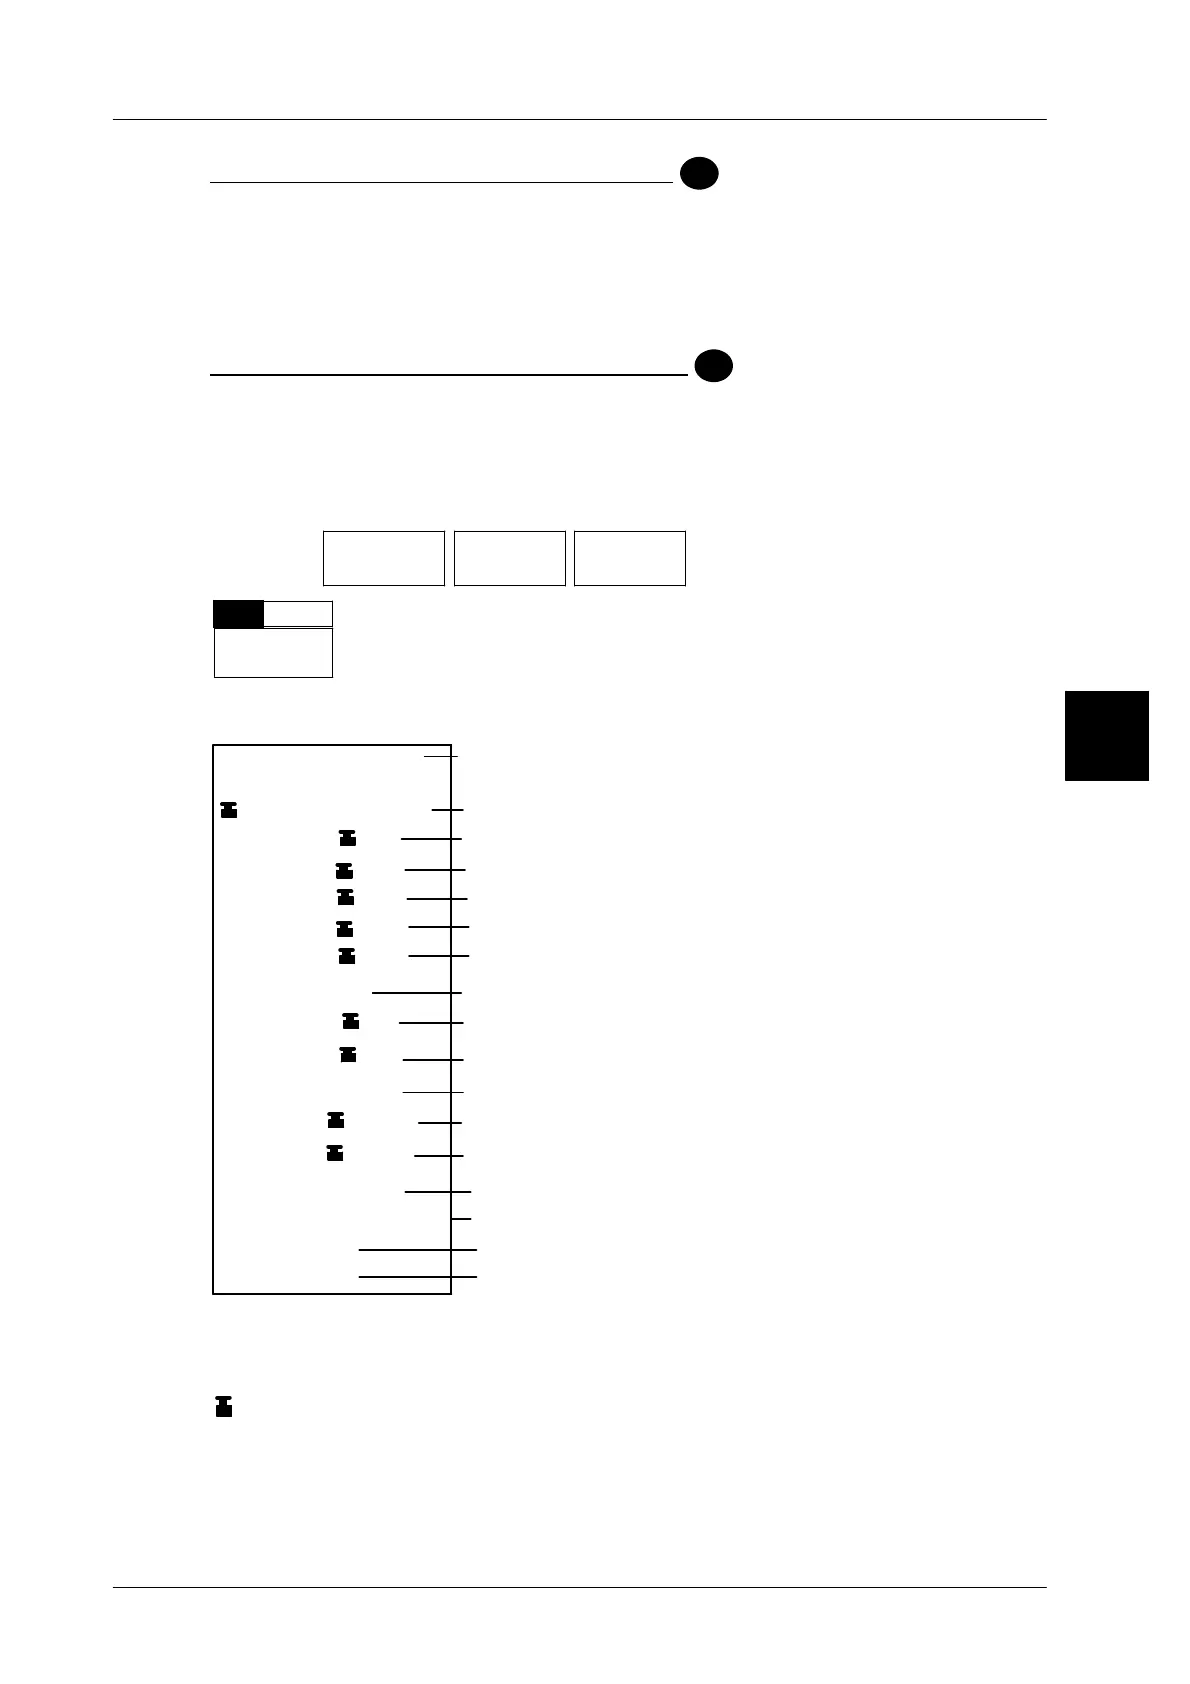
Description of the statistics data display
Number of weight class column with statistics
and selected statistics type (e.g. as per FPV)
Weight range of weight class column
Preset nominal weight Qn
Lower tol. limit 1 calculated on the basis of the nom. weight
Lower tol. limit 2 calculated on the basis of the nom. weight
Upper tol. limit calculated on the basis of the nom. weight
Total number of checked packages
Mean value of checked packages
Standard deviation of checked packages
Total number of checked packages
Mean value of checked packages
Standard deviation of accepted packages
Accepted quota
Number of packages between
TU1 and TU2
# = number of packages
= weight in grams
S = standard deviation
_ok = accepted packages
∅ =
mean value
cp value
(value for the deviation of process parameters)
cpk value
(value for the deviation of process parameters and position)
cp value >/= 1.0: the deviations are within the defined limits
cp value >/= and cpk value >/= cp value: the deviations are within the defined limits
cpk value < cp value: the mean value for the distribution is outside the tolerance middle
0.191kg--0.210kg
0.200kg Qn
0.201kg
∅
213 #
[2] Main statistics
as per FPV
205 #_ok
0.210kg
∅
_ok
92 %_ok
1.2 % ok TU1/2
0.191kg TU1
0.011kg S
0.182kg TU2
0.236kg TO
0.182kg TU
0.210kg S_ok
1.00 cp
1.00 cpk
Lower tolerance limit calculated from nominal weight
The statistics data may also be printed out as described on page 2 -- 30.
3
 Loading...