CAIVER coRpoRAIloN mDEL c-9 sERrmcE AmNUEL
SRT7
6. 0 FtJRTIONAL VERIFICRTION, ccmt.
6.5 There is no provision for adjustment of the phase networks. Hcmever,
if they deviate frcm the perfomance as described in 6.3 & 6.4, a
stage-by-stage certparison betneen channels {IC4/5 pins 3,12, 10 & 4)
should reveal the detuned elerient(s}. Replacerient of the . 001 Irmd
phase shift capacitors with knetim close-tolerance parts is the fix.
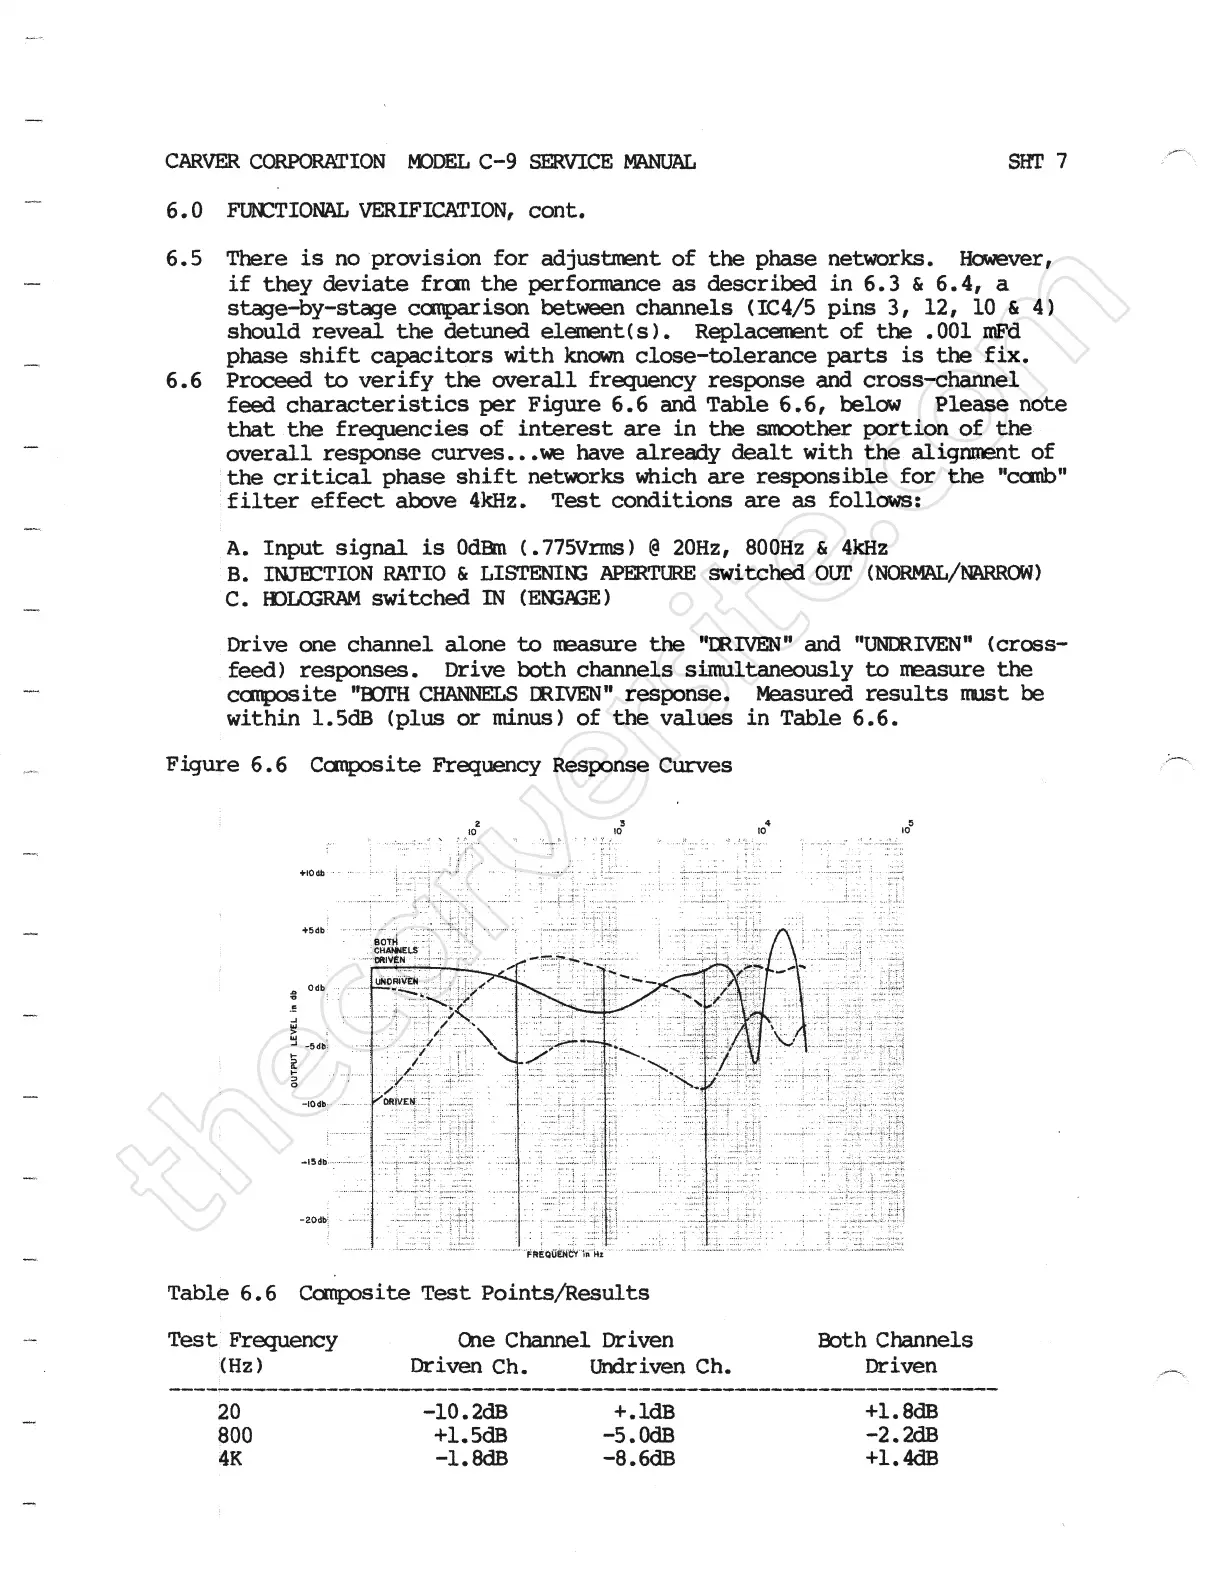
6.6 Prcoeed to verify the overall frequency response and cross-charmel
feed characteristics per Figure 6.6 and Table 6.6, below Please note
that the frequencies of interest are in the smoother portion of the
overall response curves. . .Ore have already dealt with the aligrment of
the critical phase shift netrorks which are responsible for the "ccfro"
filter effect above 4kHz. Test conditions are as follows:
A. Input signal is OdEm {.775Vrms) a 20Hz, 800Hz & 4kHz
8. marEETION RATIO & LISTENIRE apERTtJRE avitched Our {NORunL/RARROw}
c. HDlrmAM switched IN {ENGAGE)
Drive one channel alone to measure the "mlvEN" and "UREREN't {cross-
feed) responses. Drive both channels sirmltaneously to measure the
calpceite "ECxpH CHANNELS mlvEN" response. Measured re§ult§ rmst he
within i.5dB {plus or minus) of the values in Table 6.6.
Figure 6. 6 Caxposite FTequency Response Curves
Table 6. 6 Cerxposite Test Pointsflesults
Test Frequency Che charmel Driven
{Hz ) miven ch. tthdriven ch.
froth Channels
miven
20 -10. 2dB +.1dB +i. 8dB
800 +i. 5dB -5. OdB -2. 2dB
4K -i. 8dB -8.6dB +1. 4dB
 Loading...