CARVER conpoRAmloN mEL c-9 sERvlcE MziNUEL
SHT8
6. 0 FtRETIchunL VERIFICHTION, cant.
6*7 If the frequengy response tests show errors, it is adviseable to
disconnect the phase netverks tertporarily and repeat the frequency
=edsd¥:s:e:::gis:E:sa:::ff¥|::t¥[::#=:¥:tng:r¥::::±o::
this ray, troubleshcoting of the remaining input circuitry is nmc:h
nure straightforrard. Test conditions are the sarre as before, except
that two new frequencies have been edded at the upper end.
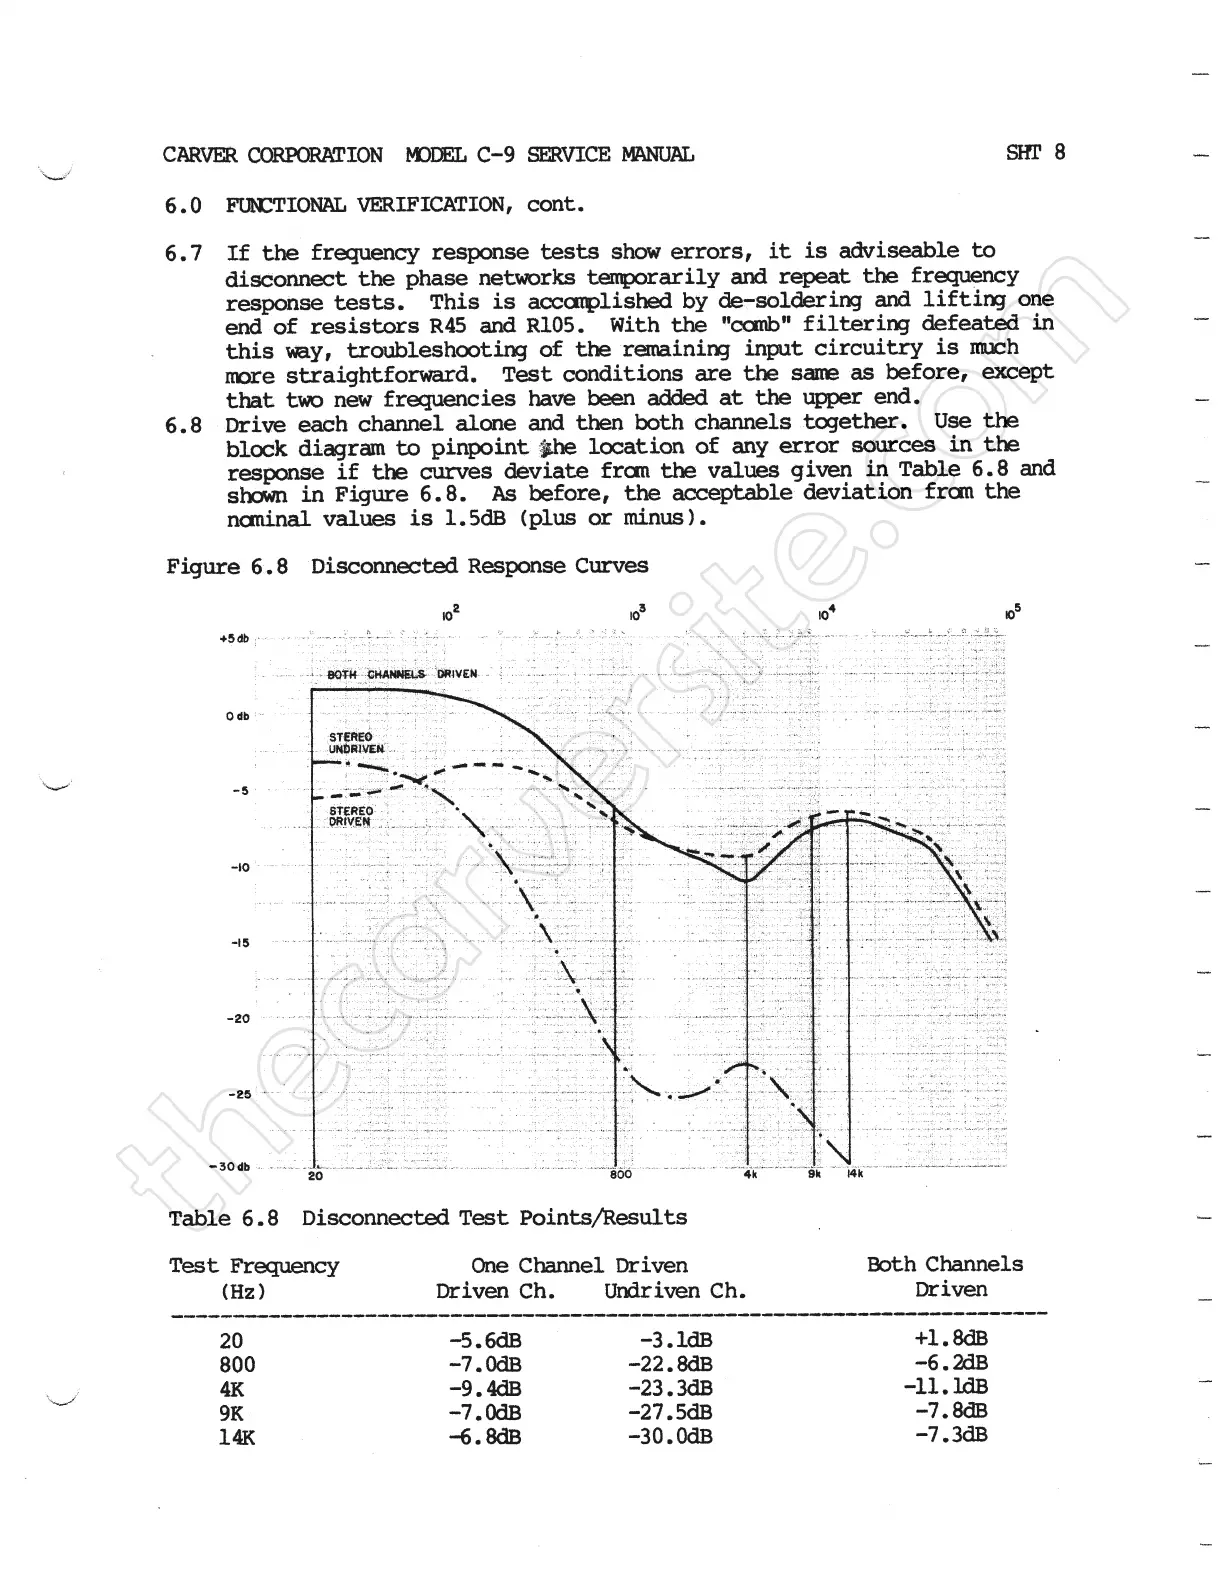
6.8 mime each channel alone and then both channels tngether. Use the
blcok diagram to pinpoint .-fate lcaation of any error sources in the
:esinpon:: i:g:h: g¥es deviate frm the values given in Table 6.8 and
As before, the acceptable deviation frcm the
nouinal values is i.5dB {plus or minus).
Figure 6. 8 Disconnected Response Curves
Table 6. 8 Disconnected Test PointsAesults
Test Frequency Cine charmel driven
(Hz } Driven ch. Undriven ch.
20
800
4K
9K
14K
-5. 6dB -3.1dB
-7. OdB -22. 8dB
-9. 4dB -23.3dB
-7. OdB -27. 5dB
rf. 8dB -30. odB
both Chapels
in:iven
+i . 8dB
-6 . RE
-11 . IdB
-7 . RE
-7 . 3dB
 Loading...