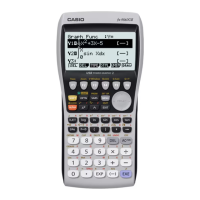
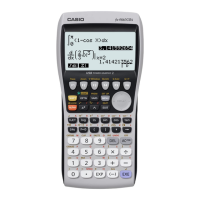
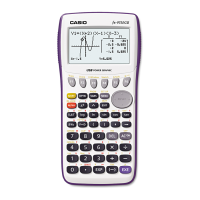
4. Press dto take you back to your list of data and select q(GPH1) and then lto
see your graph.
5.
The following screen shots show what one-variable calculations can be obtained by
pressing
q.
6.
To delete this set of data, press
duntil you return to the initial List Editor screen.
Select
ufor more options, arrow up until List 1 is highlighted, select r(Del-A),
then
q.
7.
For paired variable data, use the following:
List 1: 0.5, 1.2, 2.4, 4.0, 5.2
List 2: -2.1, 0.3, 1.5, 2.0, 2.4
Enter List 1 first, and then
$and begin entering List 2.
8.
To see a scatter-plot of these data, you can go through and change back GPH 1
using the process above, or select
w(GPH 2) from the List Editor screen whose
default is also a scatter-plot.
14 Casio “The Basics fx-9860GII”
 Loading...


