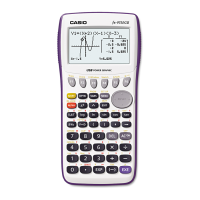
9. From the scatter-plot screen, pressing qwill show all the calculations that can be
obtained from this set of data.
10.
To calculat
e linear regression, select
wfrom the first set of options and then press
q
for form. baxy
11. From this screen, you select
y(COPY) to copy and then paste the equation into
the initial graph screen or select
u(DRAW) to show the linear regression.
15 Casio “The Basics fx-9860GII”

 Loading...


