Page | 8
Statistics [Option 2]
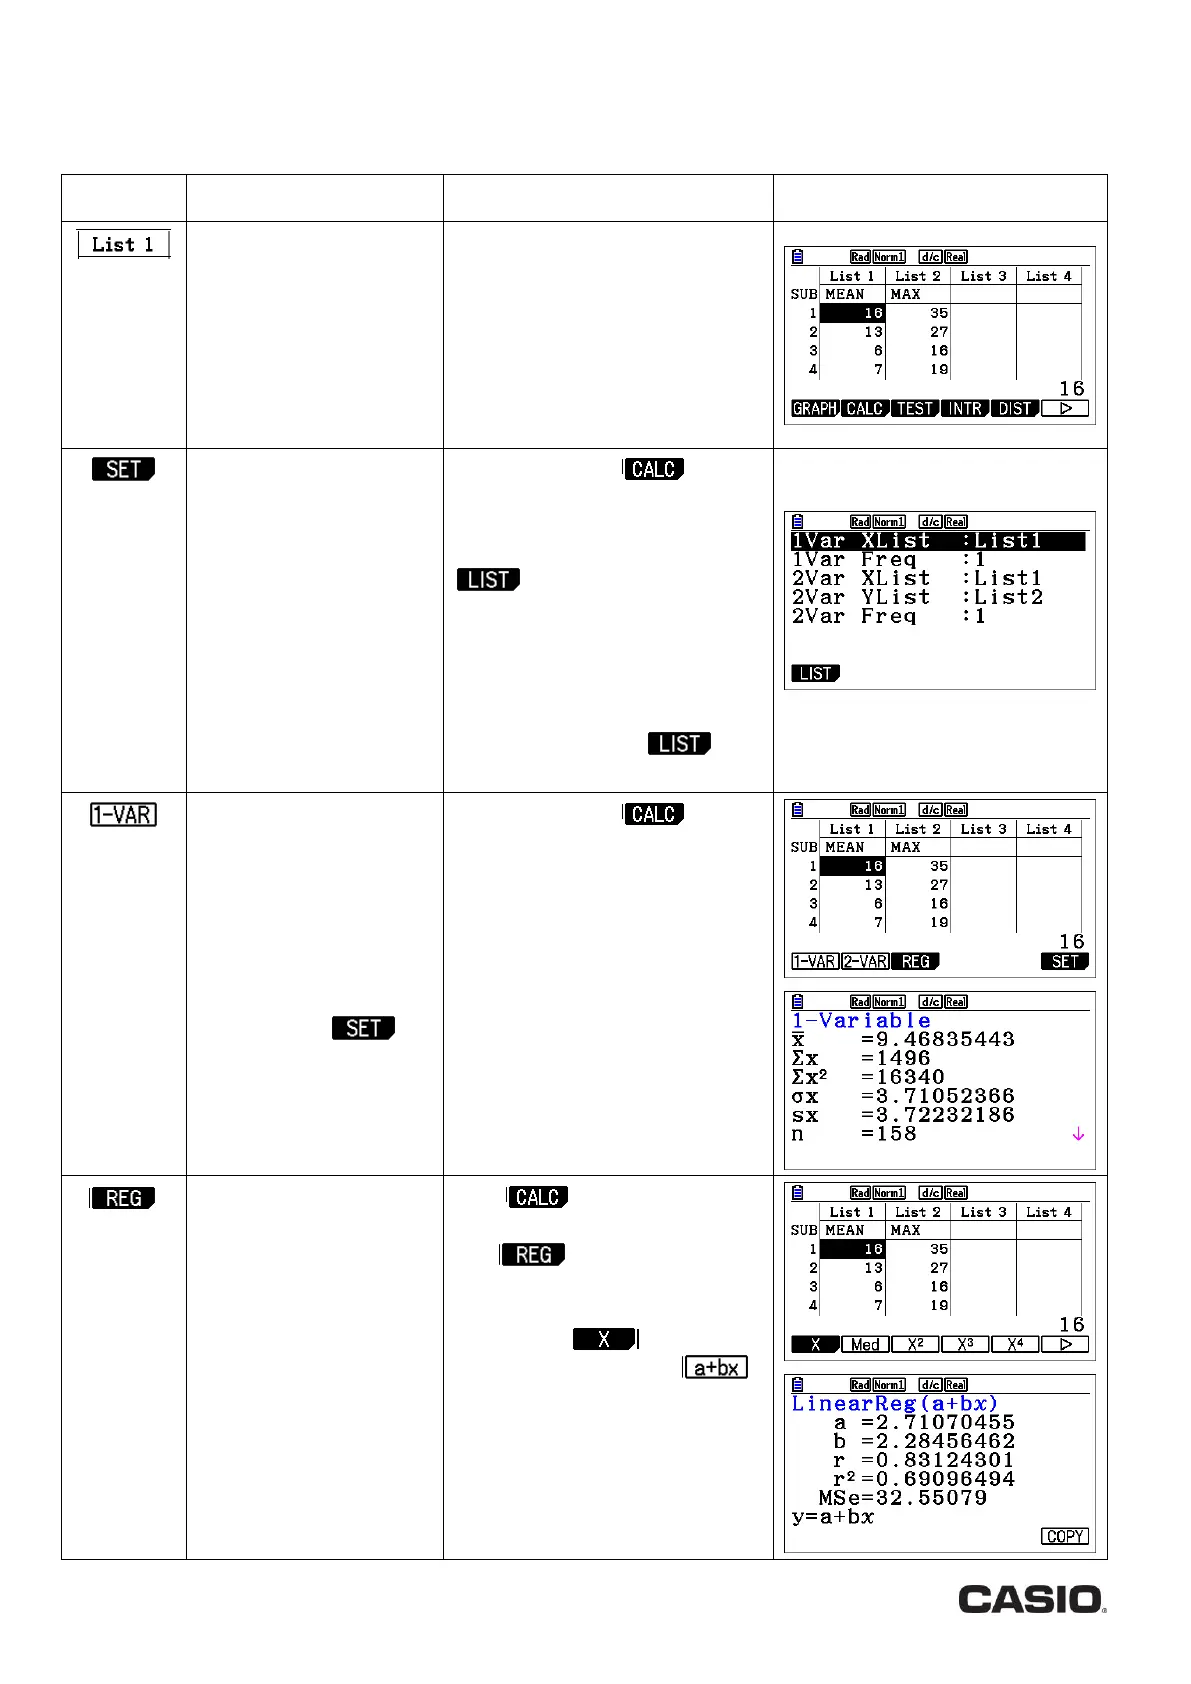
Data are stored in lists. From these, you can calculate statistics such as mean and standard deviation.
Typing in the data. Enter
the data line by line,
pressing l after each
item.
Hint: you can type a label
for the data in the cell
below the List number.
Enter the data line by line,
pressing l after each item.
Telling the calculator
which list(s) to use for
calculations.
For 1-variable statistics
set 1-Var lists.
For 2-variable statistics
(regression), set 2-Var
lists.
Press w to enter mode,
then u and scroll to the 1-Var or
2-Var lists.
XLIST is the list of values. Press
to change the List
number.
YLIST is the 2
nd
list of values for
2-variable data.
FREQ is the frequency of each
data item. This is either 1 or a list
of frequencies. Press to
specify frequencies in a list.
Calculating statistics of a
single variable, for
example mean or
standard deviation.
Hint: BEFORE USING THIS
make sure that you have
told the calculator which
list to use (see )
Press w to enter mode,
then q
Hint: use N to scroll down for
more statistics such as quartiles
Calculate regression
statistics (equation of the
regression line and the
correlation coefficient)
Press to enter the
statistics calculation menu, then
e ( ).
This will give you a choice of
regression types.
Choose q ( ) for linear
regression and then w ( )
for the equation type.

 Loading...


