3-5
Paired-Variable Statistical Graphs
•Paired-variable graphs are drawn in the LR2 mode ( S S B ) . “ LR2” appears
on the display.
•Paired-variable graphs can be drawn as regression lines.
•Standard function graphs can also be drawn in the LR2 mode, so theoretical
graphs, data distribution and regression line graphs can be overdrawn.
•After data input in the LR2 mode, points are displayed immediately, and data
is input to the statistical memory.
•When a value that exceeds the preset range is input, it is input to the statistical
memory, but the point is not displayed.
•Data is input using the (dt) key in the following format: x data B E ]y data BCD
frequency (d t).
•The (cl) key is used to edit data after input is complete, but points that are produced
on the display are not cleared. (Point appears even when data is corrected by
the (c0 key).
•Points on the display cannot be retrieved if the display is cleared (isiiiFflfcisliBi])
■ Drawing paired-variable statistical graphs
•Procedure
©Specify the LR2 mode ( S @ B ) .
©Set the range values (W ).
©Clear the statistical memory (Bdidi)).
©Input data (x data BED y data BED frequency (dt)).
©Draw the graph ( S B ® 1 (III).
*Data input method in step 4 is the same as that for Regression calculation
(page 69).
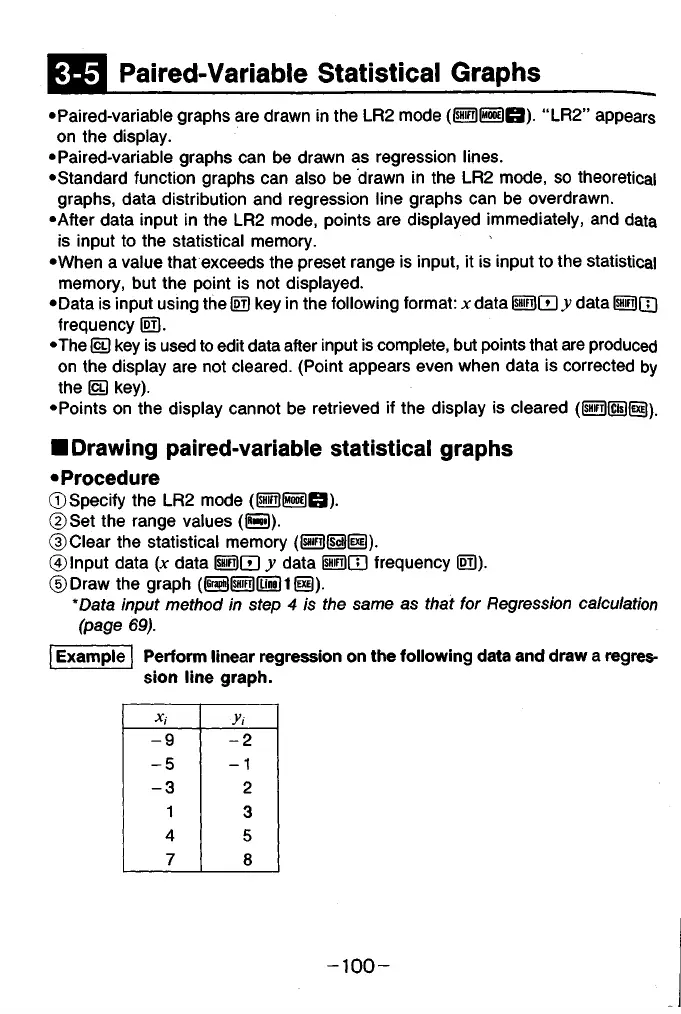
Example Perform linear regression on the following data and draw a regres
sion line graph.
Xj
Ji
-9 - 2
-5
- 1
-3 2
1
3
4
5
7
8
- 1 0 0 -