©Specify the LR2 mode (H U S H )-
©Set the range values to those shown in the table.
Xmin :
- 1 0
Ymin : -5
Xmax :
10
Ymax :
15
Xscl : 2 Yscl :
5
*According to the generaI rule of the x-axis range values, the values for x are:
-10^x< 10 .
©Clear the statistical memories.
IsHirfHsciliixil
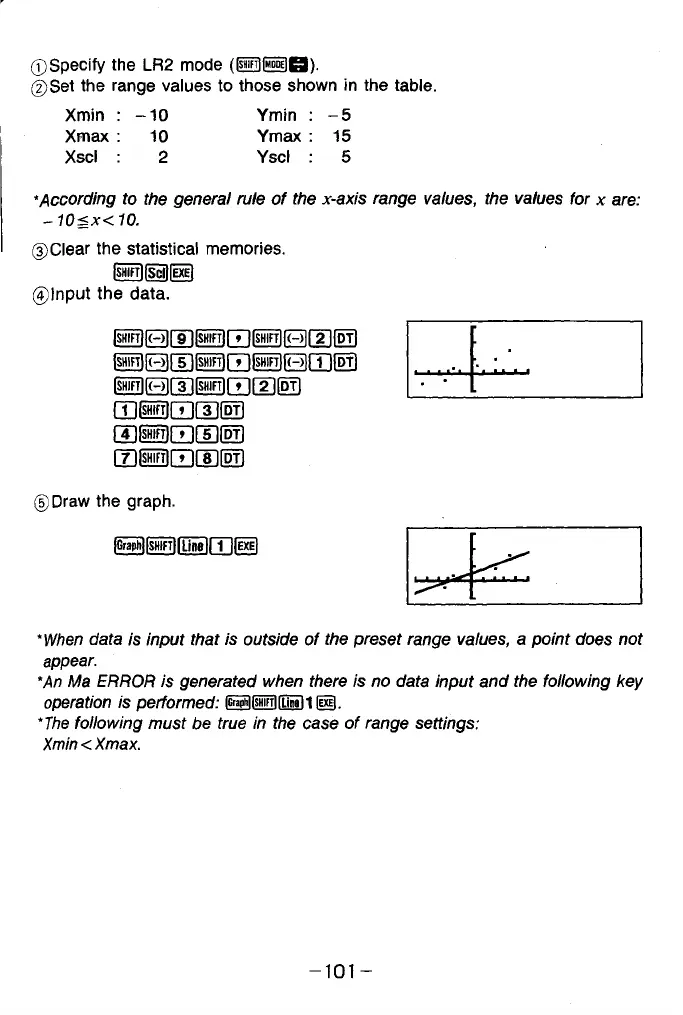
©Input the data.
@0GD®CEI®@[I]!i)
IsiiirTlRITIlsiiirflR rritDTl
(T](il3QGD(DT)
[T)0ig[7](T|(DT)
0 B 0 1 1 ] !
©Draw the graph.
'When data is input that is outside of the preset range values, a point does not
appear.
'An Ma ERROR is generated when there is no data input and the following key
operation is performed: Q @ (lE )1 @.
*The following must be true in the case of range settings:
Xmin<Xmax.
-1 0 1 -