■Overdrawing built-in function graphs
Two or more different built-in function graphs can be drawn together on the same
display. Since the range for the first graph is automatically set, all subsequent
graphs on the same display are produced according to the range of the first graph.
The first graph is produced by using the previously mentioned operation O [func-
tion key] (¡1 ).
Subsequent graphs are produced using the variable X in the operation S [func
tion key] S S B Ie I. By inputting after the function key, the range is un
changed and the next graph is produced without clearing the existing display
(see page 83).
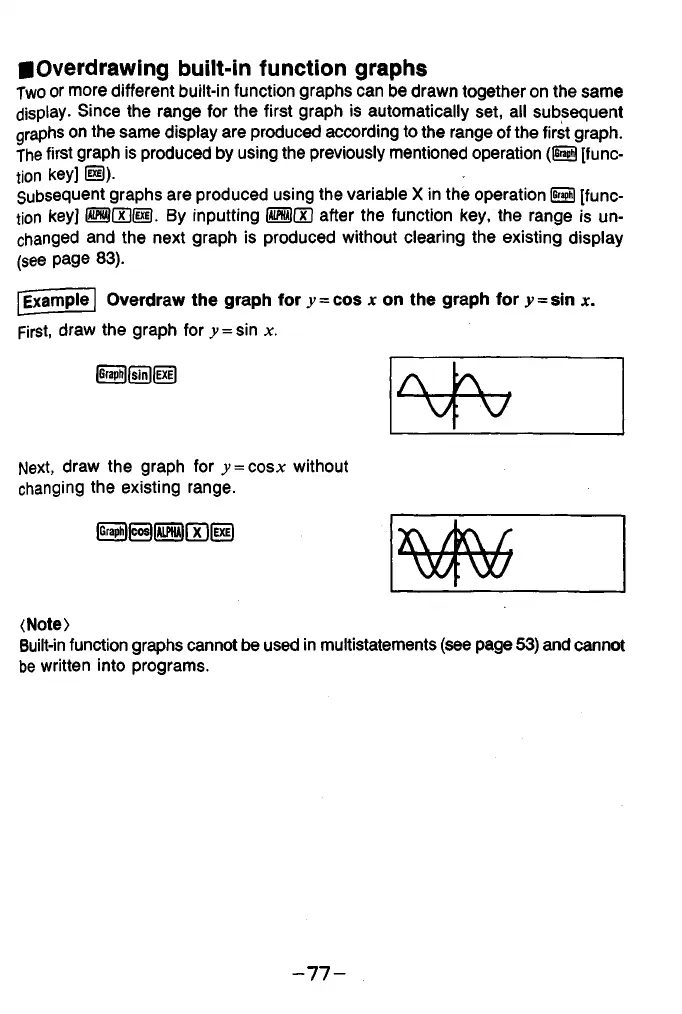
Example Overdraw the graph for y = cos x on the graph for .y=sin *.
First, draw the graph for >> = sin x.
|Graph|fsin|fixEl
Next, draw the graph for y -co s x without
changing the existing range.
|Graph||cos||ALPHAirx ||EXE|
(Note)
Built-in function graphs cannot be used in multistatements (see page 53) and cannot
be written into programs.
- 7 7 -