3-2
User Generated Graphs
Built-in function graphs can aiso be used in combination with each other. Graph-
ing a formula such as.y = 2x2 + 3;t-5 makes it possible to visually represent the
solution.
Unlike built-in functions, the ranges of user generated graphs are not set auto
matically, so graphs produced outside of the display range do not appear on the
display.
■Range parameters
After pressing the S key, you can look up and specify the range parameters
for the x- and y- coordinates. Range parameters consist of maximum and mini
mum values for each axis, as well as their scales (distance between hash marks).
Before drawing a graph, you should first specify range parameters to set the size
of the graph.
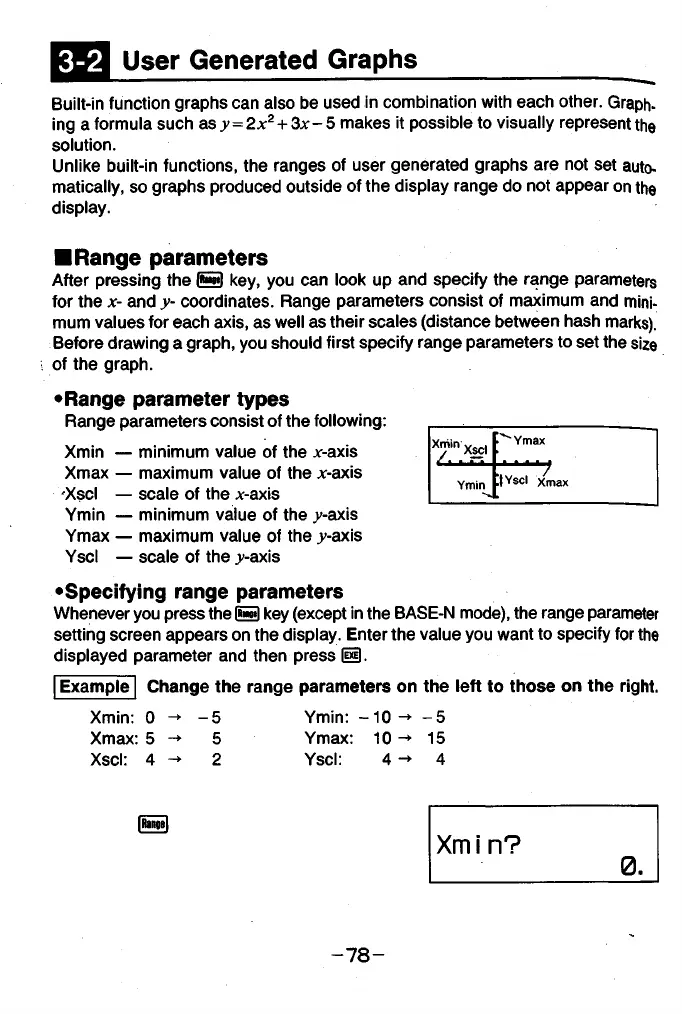
•Range parameter types
Range parameters consist of the following:
Xmin — minimum value of the x-axis
Xmax — maximum value of the x-axis
OCscI — scale of the *-axis
Ymin — minimum value of the .y-axis
Ymax — maximum value of the .y-axis
Yscl — scale of the .y-axis
•Specifying range parameters
Whenever you press the S key (except in the BASE-N mode), the range parameter
setting screen appears on the display. Enter the value you want to specify for the
displayed parameter and then press (iD.
Xy ' n XSCl
Ymax
Ymin
it Yscl xmax
Example Change the range parameters on the left to those on the right.
Xmin: 0 -5
Ymin:
- 1 0 -
-5
Xmax: 5 -► 5 Ymax: 10 -
15
Xscl: 4 -►
2
Yscl:
4 -
4
|Range|
Xmi n?
0.
- 7 8 -