•Range reset
Range values are reset to their initial values by pressing during range
display.
The initial values are as follows.
Xmin : -3.8 Ymin
Xmax : 3.8 Ymax
Xscl : 1 Yscl
(Reference)
Range settings are performed within programs using the following format:
S Xmin value, Xmax value, Xscl value, Ymin value, Ymax value, Yscl value
Up to six data items are programmed after the S command. When less than
six items are programmed, range setting is performed in the order from the be
ginning of the above format.
■User generated function graphs
After performing range settings, user generated graphs can be drawn simply by
entering the function (formula) after pressing S .
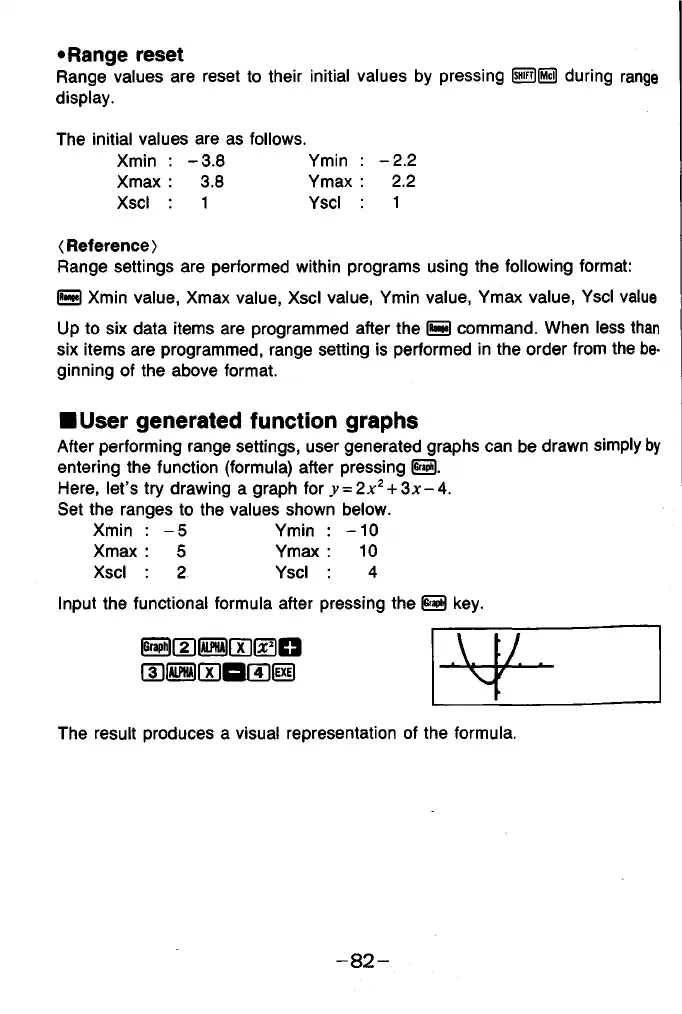
Here, let’s try drawing a graph for y = 2x2 + 3x-4 .
Set the ranges to the values shown below.
Xmin :
-5 Ymin :
- 1 0
Xmax : 5
Ymax :
10
Xscl :
2 Yscl
4
Input the functional formula after pressing the S key.
ifrg f2 i r a n n i F in
IT IiM rx 1 B IT )(5i|
The result produces a visual representation of the formula.
- 2.2
2.2
1
- 8 2 -