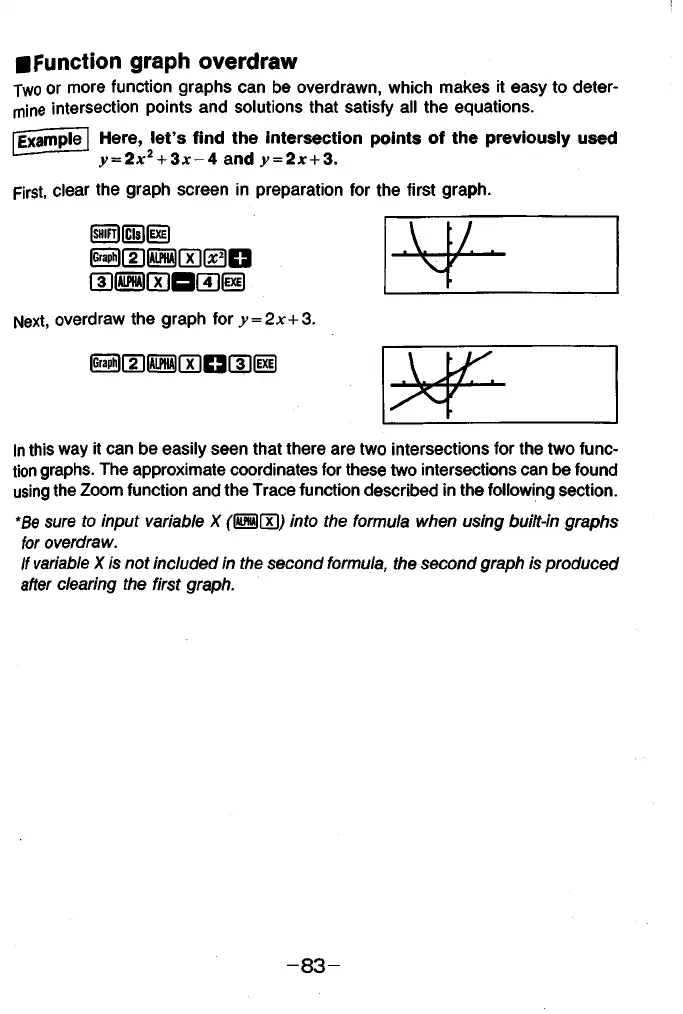
■Function graph overdraw
Two or more function graphs can be overdrawn, which makes it easy to deter
mine intersection points and solutions that satisfy all the equations.
Example Here, let’s find the intersection points of the previously used
y = 2x2 + 3x-4 and y = 2x + 3.
First, clear the graph screen in preparation for the first graph.
ISHlFTlfCislfEXEl
r a f T i m r x i f ^ n
n m i( iiH ( 4 ] @
Next, overdraw the graph for y = 2x+3.
- M
\ L ~
M
F
In this way it can be easily seen that there are two intersections for the two func
tion graphs. The approximate coordinates for these two intersections can be found
using the Zoom function and the Trace function described in the following section.
*Be sure to input variable X fW fxl) into the formula when using built-in graphs
for overdraw.
If variable X is not included in the second formula, the second graph is produced
after clearing the first graph.
- 8 3 -