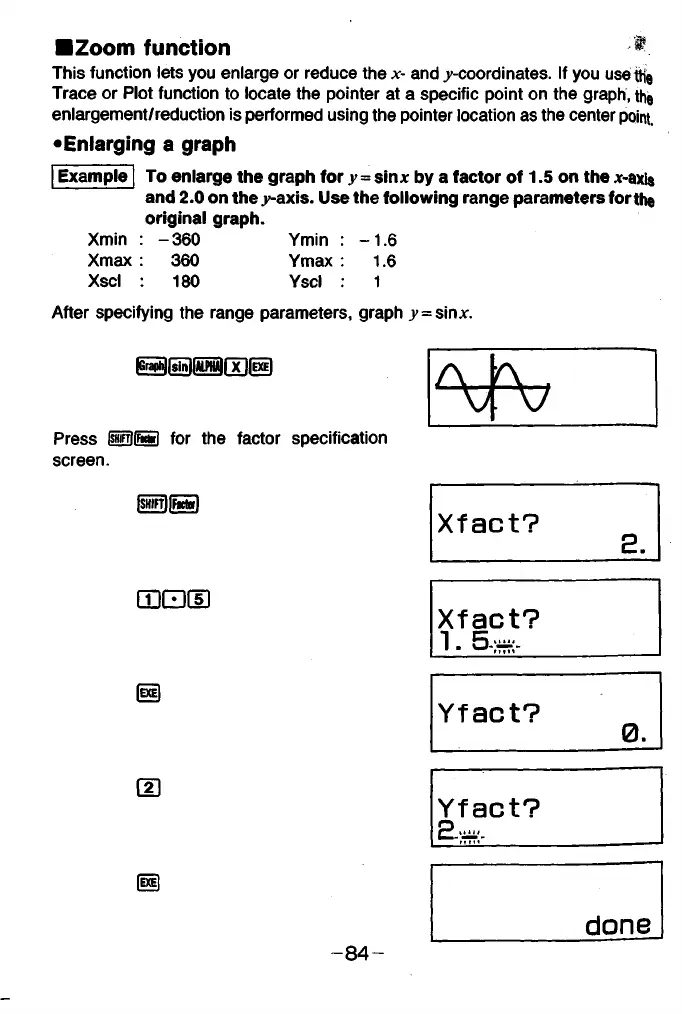
This function lets you enlarge or reduce the x- and ^-coordinates. If you use the
Trace or Plot function to locate the pointer at a specific point on the graph, the
enlargement/reduction is performed using the pointer location as the center point,
•Enlarging a graph
| Example | To enlarge the graph for y = sinx by a factor of 1.5 on the x-axis
and 2.0 on the^-axis. Use the following range parameters for the
original graph.
Xmin : -360 Ymin : -1.6
Xmax : 360 Ymax : 1.6
Xscl : 180 Yscl : 1
After specifying the range parameters, graph y=smx.
■Zoom function
r a r a r a r x iis ii
' W j
Press B S for the factor specification
screen.
Isi^lSSf)
□ D Q d )
HD
d ]
HD
Xfact?
E.
Xfact?
1 . & 3%-
Yf act?
0.
Yf act?
done
- 8 4 -