* Whenever you try to change the factor value while a graph is displayed, the dis
play changes to the text screen automatically. To return to the graph screen after
changing the factor value, press B o / 'S .
i§ (o r GED)
press SBIgwSI to enlarge the graph accord-
jng to the factors you specified.
ISHIFTllZBBWxfl
\ I
Y \
\ a
\
Let’s take another look at the range parameters.
Xmin
Xmax
Xscl
240
240
180
Ymin
Ymax
Yscl
- 0.8
0.8
1
If you press Wlzwwixfi again, the graph is enlarged once more by the factors you
specified. To return the graph to its original size, press
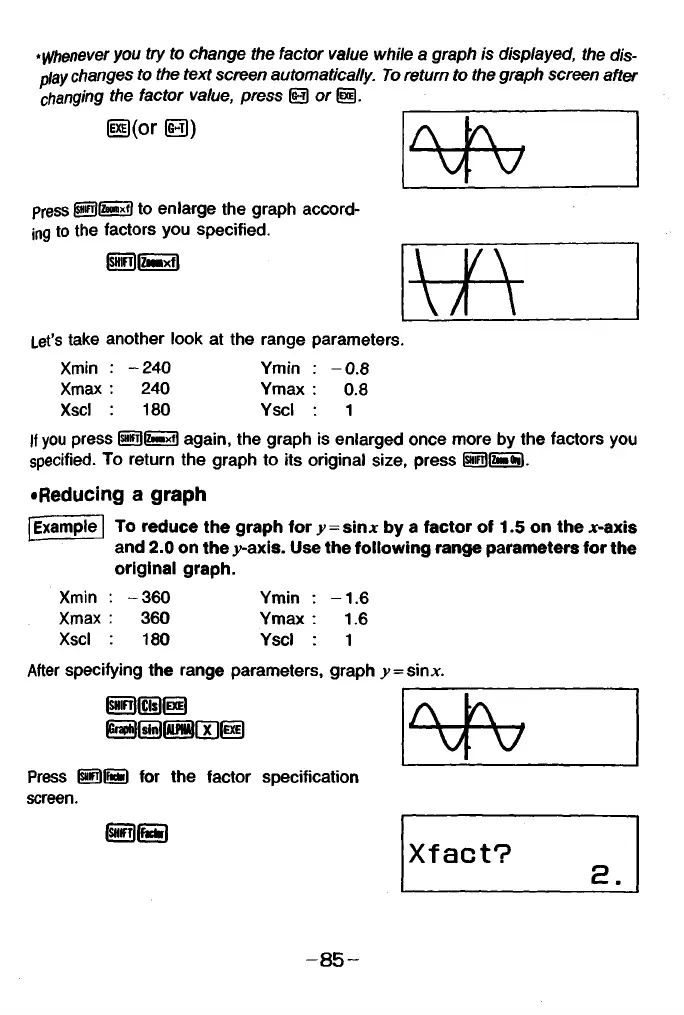
•Reducing a graph
Example
To reduce the graph for >>=sinjc by a factor of 1.5 on the x-axis
and 2.0 on the .y-axis. Use the following range parameters for the
original graph.
Xmin
Xmax
Xscl
-360
360
180
Ymin
Ymax
Yscl
- 1.6
1.6
1
After specifying the range parameters, graph y=
sinx
@ | S )@
lj^[siflrafip(EXEl
A J
K #
M
V
Press @ 6 3 for the factor specification
screen.
Islrllga
X f a c t ?
2 .
- 8 5 -