This function lets you move a pointer around a graph and display the x- and y-
coordinates of the current pointer location. You enlarge or reduce the x- and y-
coordinates. You can display the coordinates using either seven digits or eleven
digits (including negative sign).
•Using the trace function
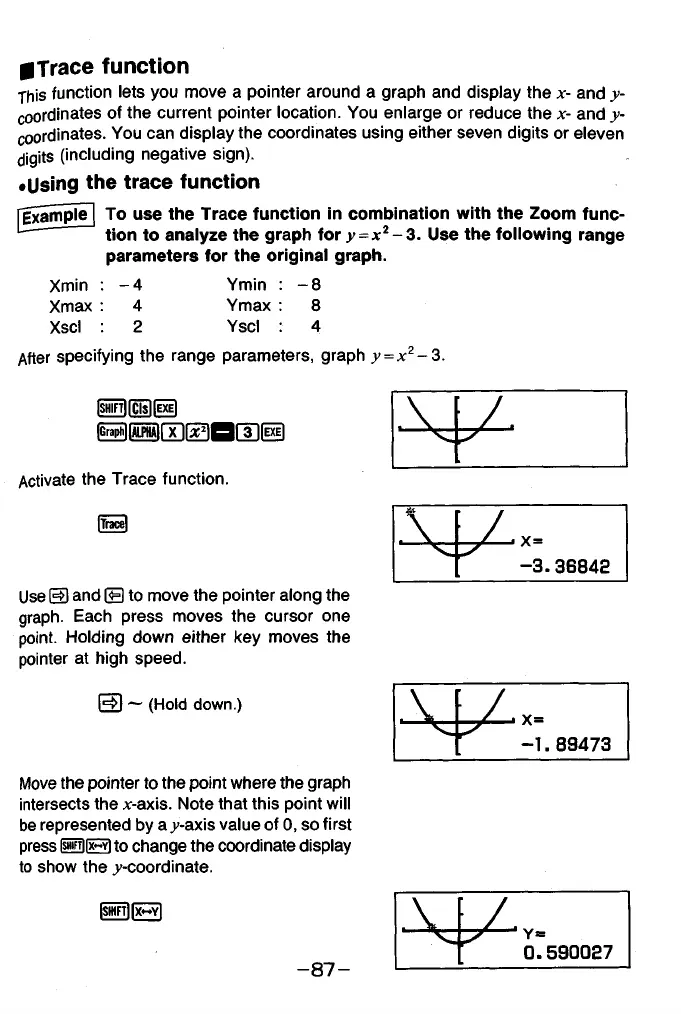
To use the Trace function in combination with the Zoom func
tion to analyze the graph for ^ = jc2-3 . Use the following range
g Trace function
parameters for the original graph.
Xmin
Xmax
Xscl
-4
4
2
Ymin
Ymax
Yscl
-8
8
4
After specifying the range parameters, graph y =
-3.
|SHIFT||Cls|fixi]
Activate the Trace function.
•V!
f / . X -
T-S
-3.36843
Use ED and ® to move the pointer along the
graph. Each press moves the cursor one
point. Holding down either key moves the
pointer at high speed.
EE ~ (Hold down.)
. v
f / . X .
V .
- 1.89473
Move the pointer to the point where the graph
intersects the A>axis. Note that this point will
be represented by a j-axis value of 0 , so first
press SGE3 to change the coordinate display
to show the ^-coordinate.
[smrflfx^Yl
- 8 7 -
^ 0.590037