The Plot function is used to mark a point on the screen of a graph display. The
point can be moved left, right, up and down using the cursor keys, and the coor
dinates for the graph displayed can be read. Two points can also be connected
by a straight line (see Line function, page 93).
Press H i and specify the *- and ^-coordinates after the “ Plot” message.
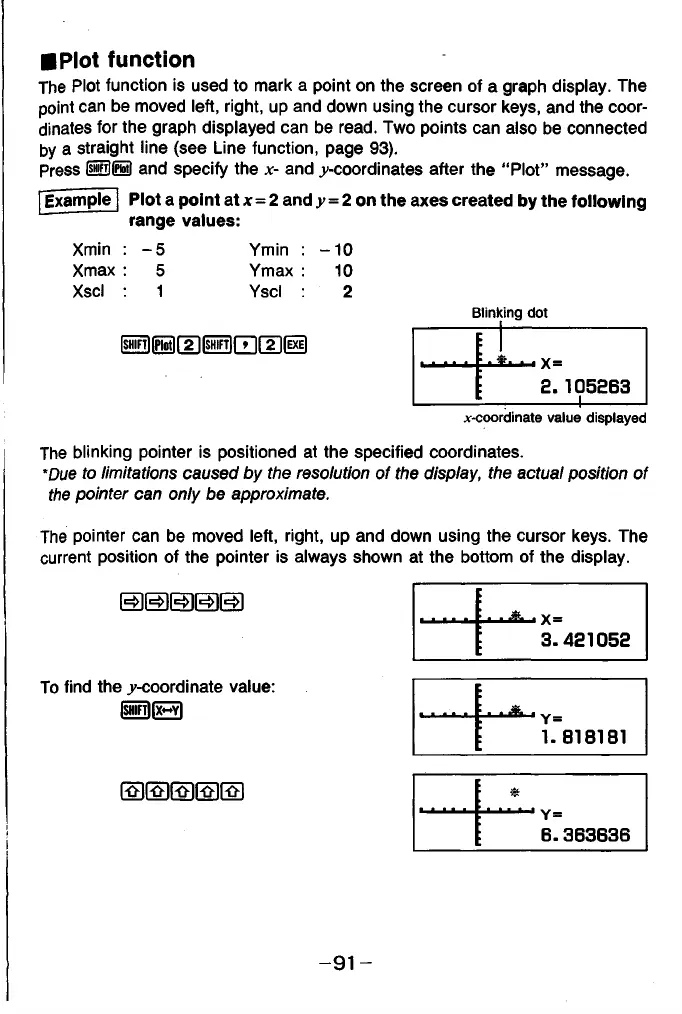
Plot a point at x = 2 and y = 2 on the axes created by the following
range values:
■Plot function
Blinking dot
Example
Xmin :
-5 Ymin :
- 1 0
Xmax :
5 Ymax :
10
Xscl 1
Yscl 2
: . . . y -
2 . 1 0 5 6 6 3
:
----------------------------------------------
1
------------------------------
^-coordinate value displayed
The blinking pointer is positioned at the specified coordinates.
*Due to limitations caused by the resolution of the display, the actual position of
the pointer can only be approximate.
The pointer can be moved left, right, up and down using the cursor keys. The
current position of the pointer is always shown at the bottom of the display.
• . .
3.421052
To find the ^-coordinate value:
|SHIFT||X~Y|
c. . & . y
1.818181
(3 (D ID (D I3
1 Y =
6.363636
- 9 1 -