As you can see above, the Trace and Zoom functions can be used to locate the
pointer at an approximate point, and then I B produces a readout of the coor
dinates.
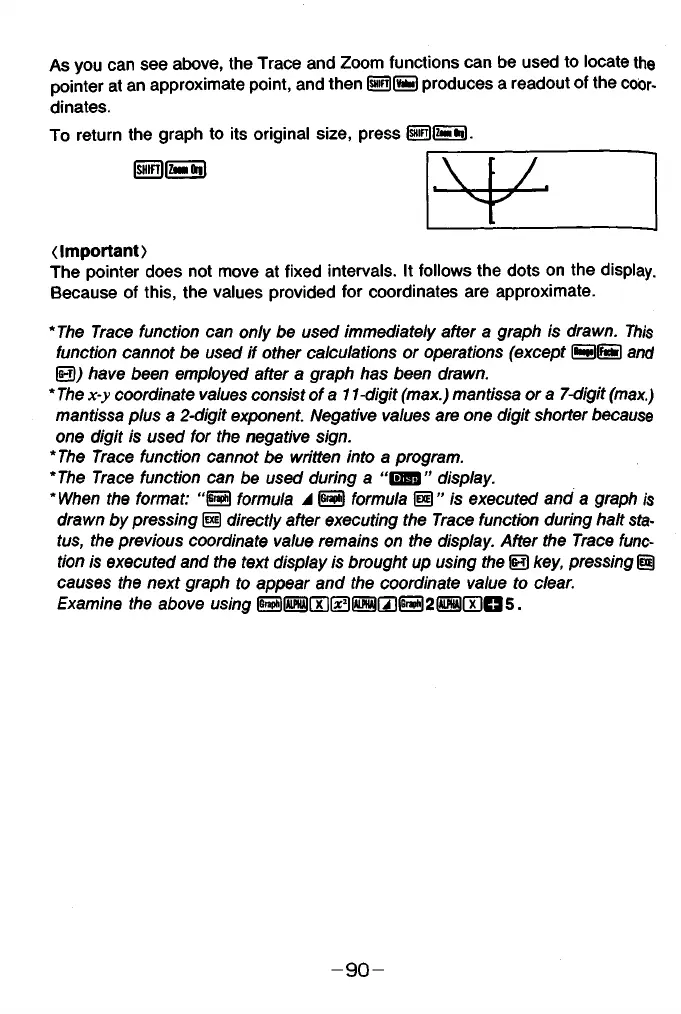
To return the graph to its original size, press SGBjfi).
(Important)
The pointer does not move at fixed intervals. It follows the dots on the display.
Because of this, the values provided for coordinates are approximate.
*The Trace function can only be used immediately after a graph is drawn. This
function cannot be used if other calculations or operations (except B B and
GE),) have been employed after a graph has been drawn.
*The x-y coordinate values consist of a 11-digit (max.) mantissa or a 7-digit (max.)
mantissa plus a 2-digit exponent. Negative values are one digit shorter because
one digit is used for the negative sign.
*The Trace function cannot be written into a program.
*The Trace function can be used during a “E S 3” display.
*When the format: “H formula A S formula is executed and a graph is
drawn by pressing (H directly after executing the Trace function during halt sta
tus, the previous coordinate value remains on the display. After the Trace func
tion is executed and the text display is brought up using the IS key, pressing H§
causes the next graph to appear and the coordinate value to clear.
Examine the above using .
fSHiFTl|ZogroOrg|
- 9 0 -